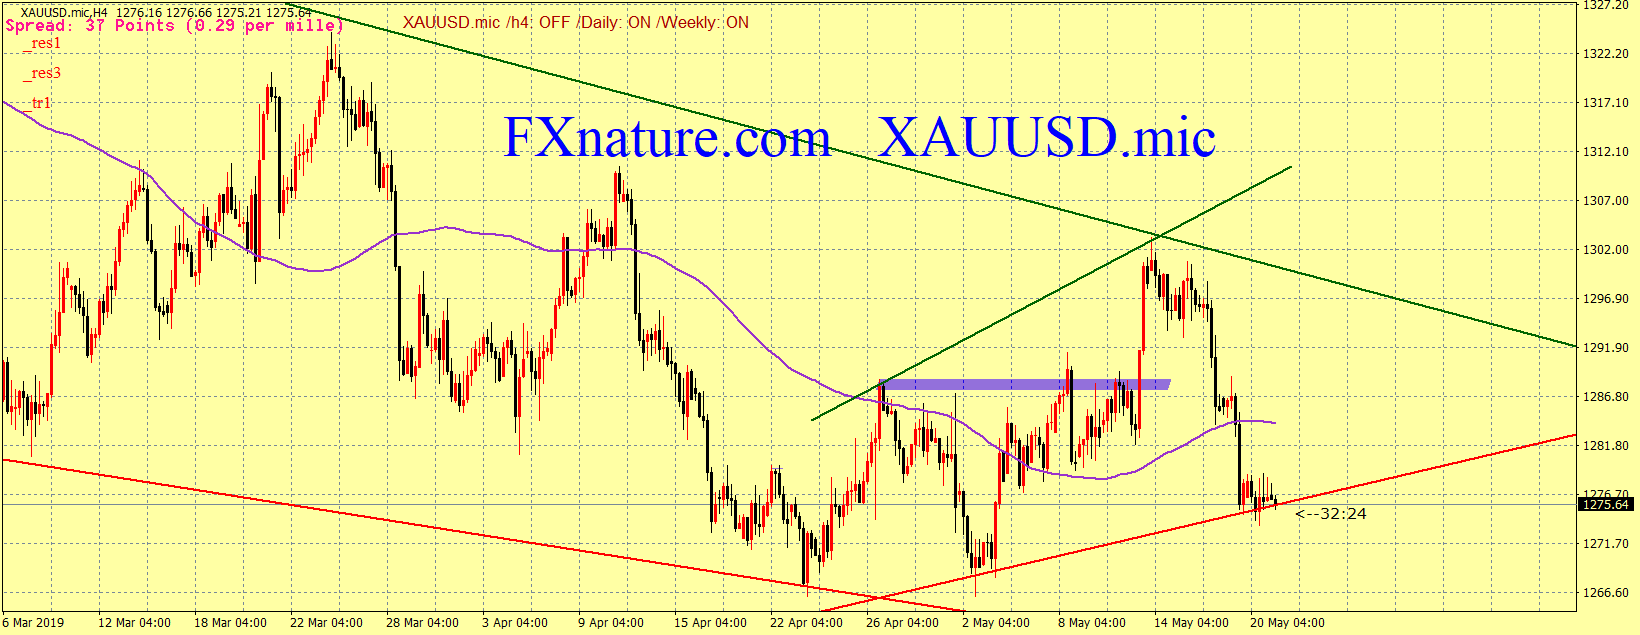
GOLD
The analysis of the previous day in the daily time frame continues. In addition, as seen in the 4 hour time frame , the price has hit several times the lower trend line . Here we are waiting for reaction. If this line breaks down, we will expect a significant drop in that. If the return sign is also present, the aim of the trend line is the green trend line.
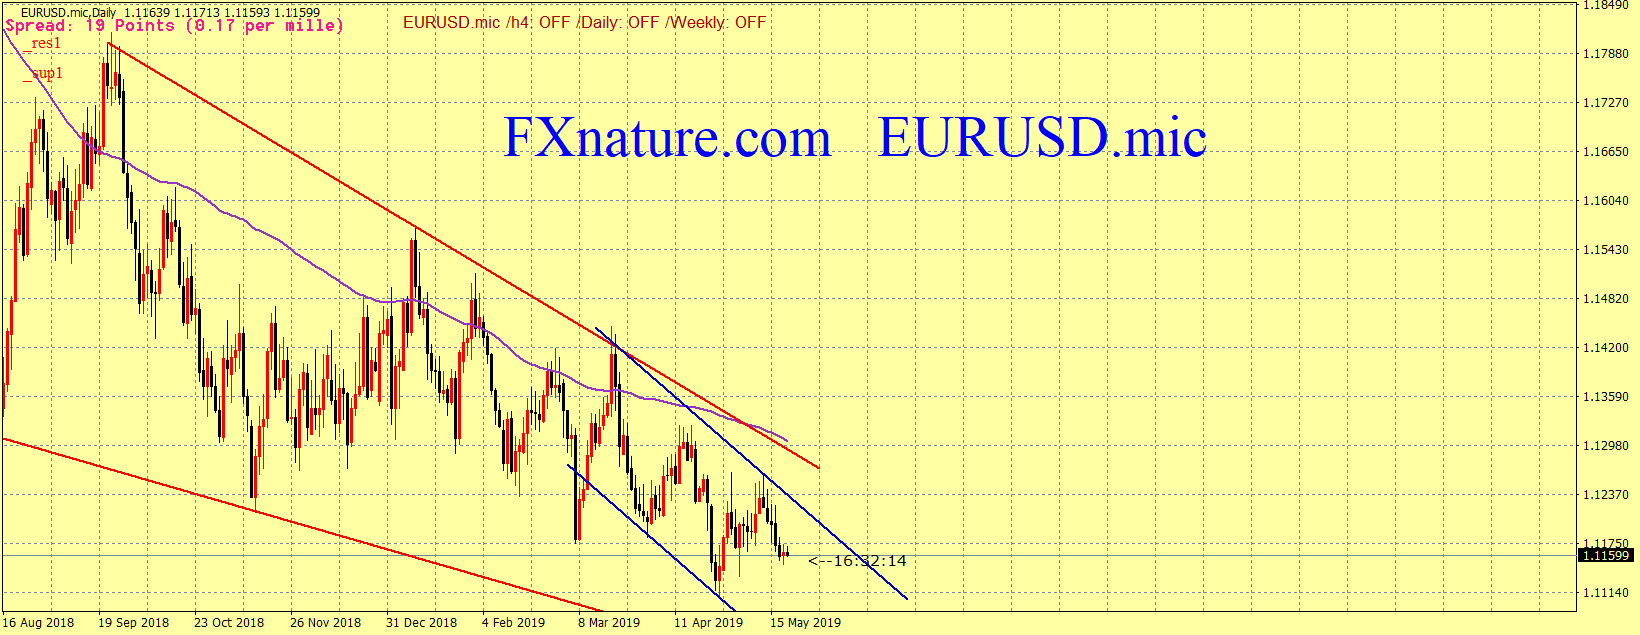
EURUSD
Prices take place in the wedge pattern and move on the blue channel. Now the price has hit the upper line of channel and is falling. We expect target at lower line of channel around 1.1050.
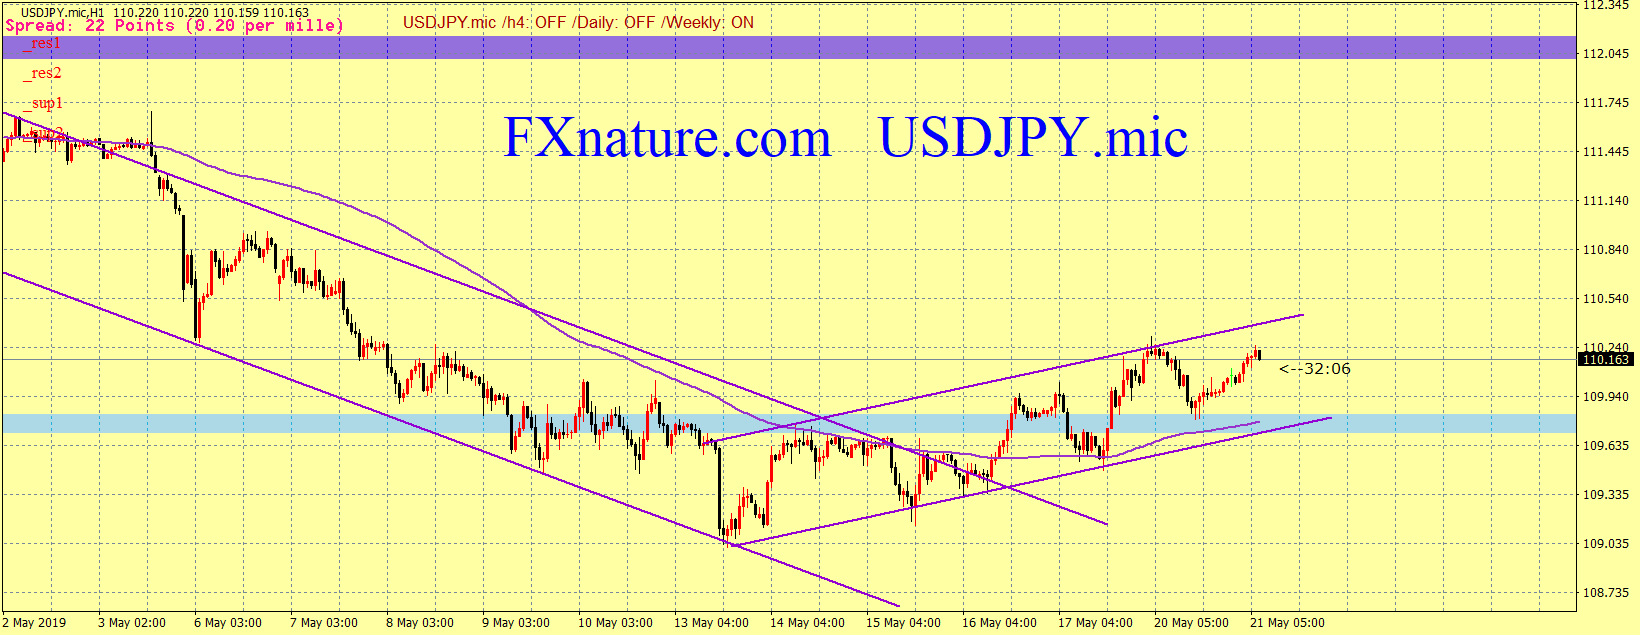
USDJPY
After a few days’ bearish movement, and breaking out of the support area we have bullish move which has broken its previous channel and previous support zone (current resistance). The price path is based on the new channel. Can be short position at the bottom of the channel with the aim of the upper line of the channel. The goal of the future can also be the 112 range.
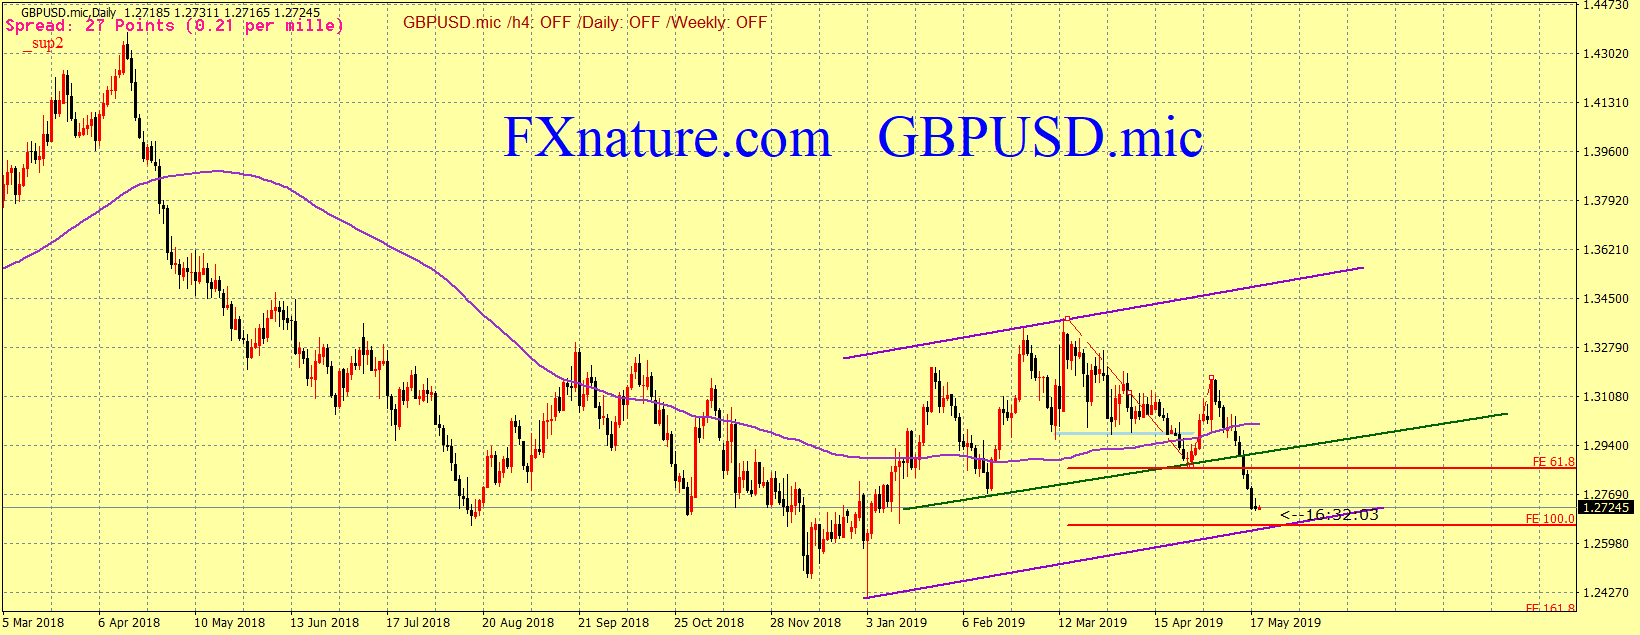
GBPUSD
The last week’s price broke the green line and dropped dramatically. As can be seen, this drop can continue to the bottom of the channel that fits with the Fibonacci Expansion of the previous move. Therefore, we are waiting for the price reaction.
USDCAD
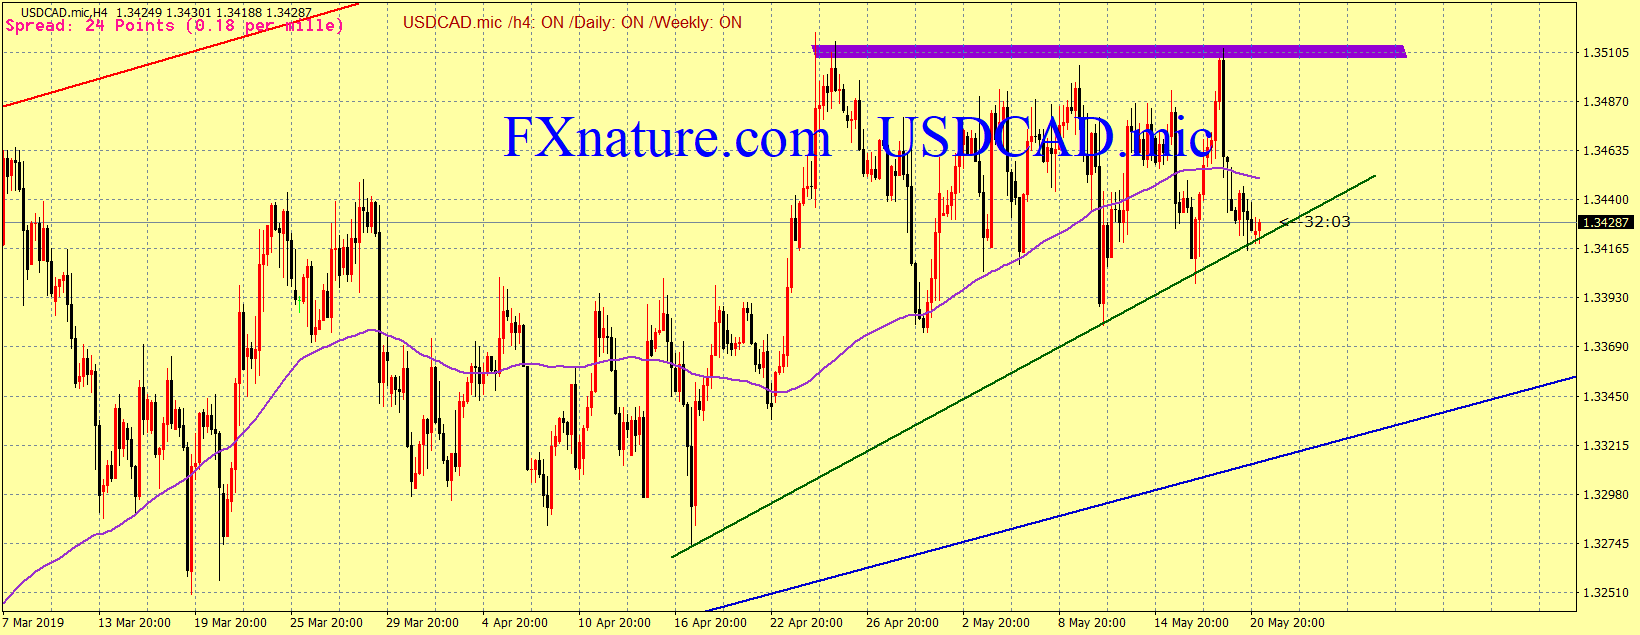
The price is on the set path in the triangle pattern. The direction of movement and price between the upper line of the triangle (resistance zone) and the lower line of the triangle is the trend line. The price is now in the vicinity of this trend line. We should see the price response against this line. If it breaks down, it will wait for a fall and if there is a return sign, we will wait for movement up to the upper line of the triangle.
NZDUSD
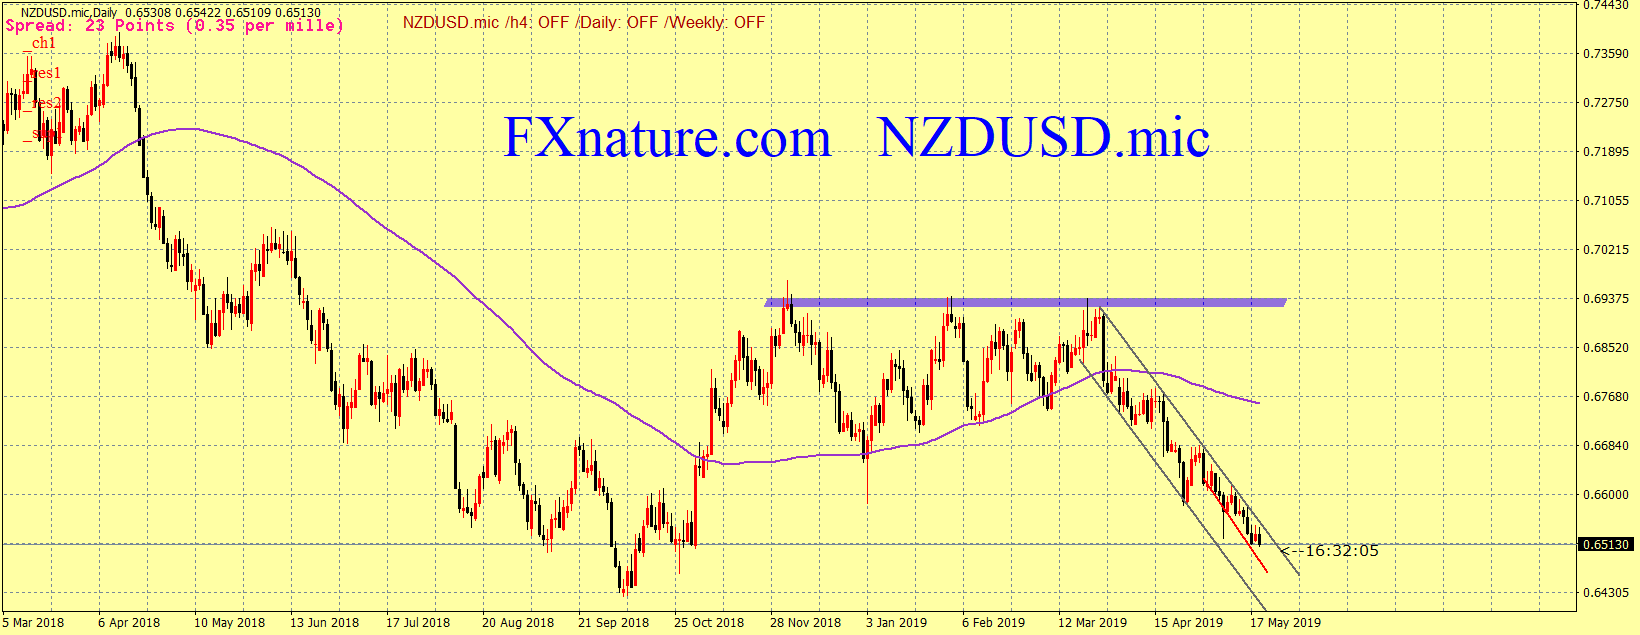
Prices are falling in the vicinity of the upper line of channel. In fact, it has created a small channel in the larger channel. Can be short at the upper line of the channel. We expect this drop to reach the level of 0.6420, which completes the triple top pattern in the daily period.
AUDUSD
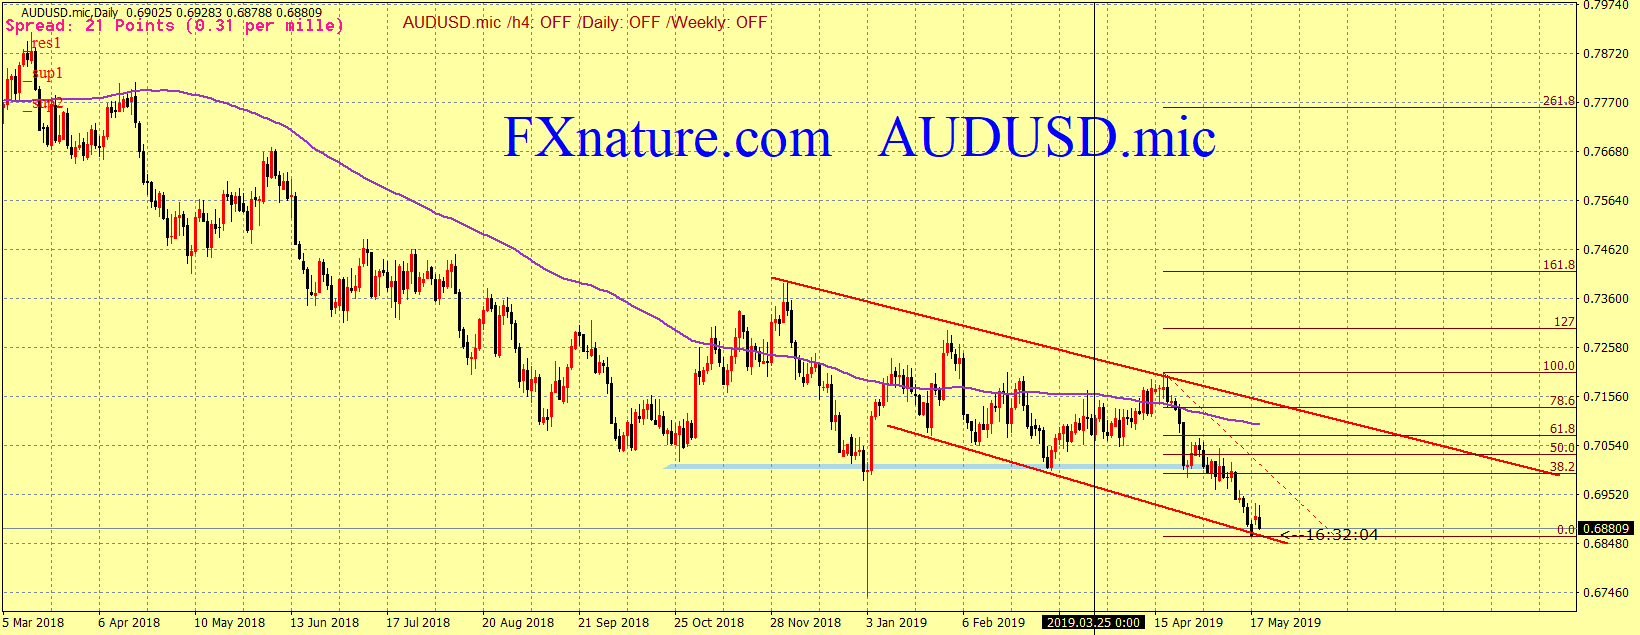
The price hit its channel to the lower line of the channel and it’s back. We expect to move up to the upper line of the drawn channel. We know the current target at 0.7070.

