
27 May 2021
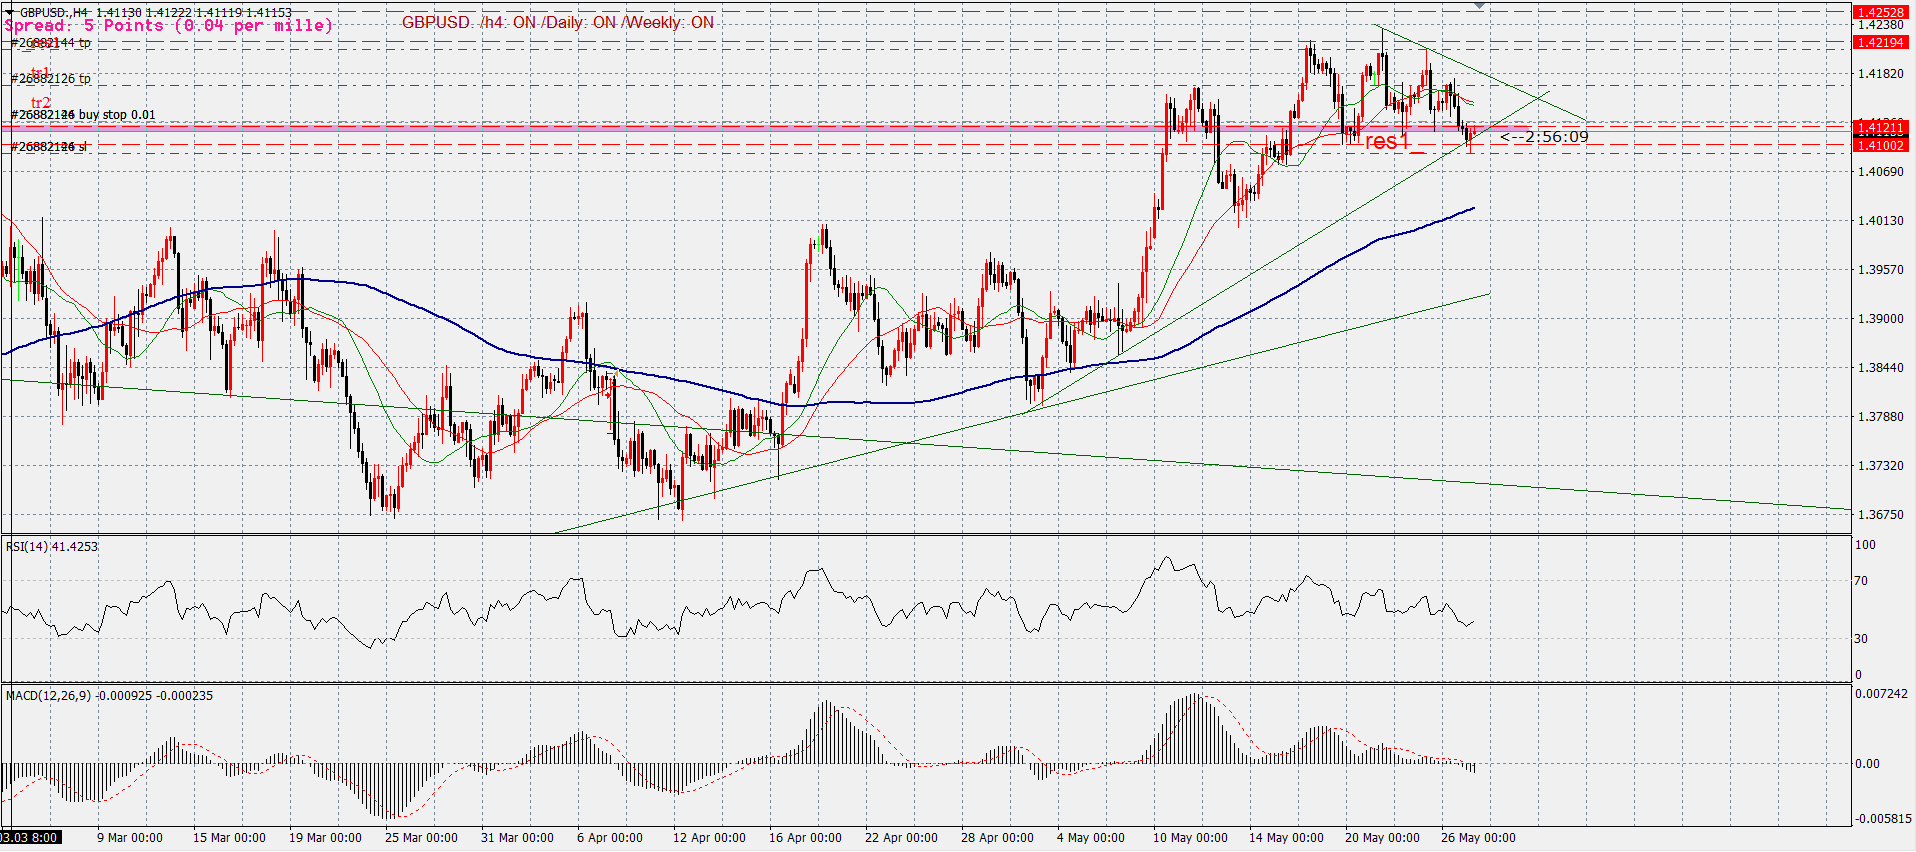
According to the chart, in the H4 time, the price hit the trend line in the first place, based on which a Hidden divergence occurred. In addition, we are at the resistance level at 1.4116. The sum of all the conditions can provide a good warning for the long position. With these conditions we have
buy @1.4130 Sl 1.4090 tp1@1.4164, tp2@1.4210
USDCAD
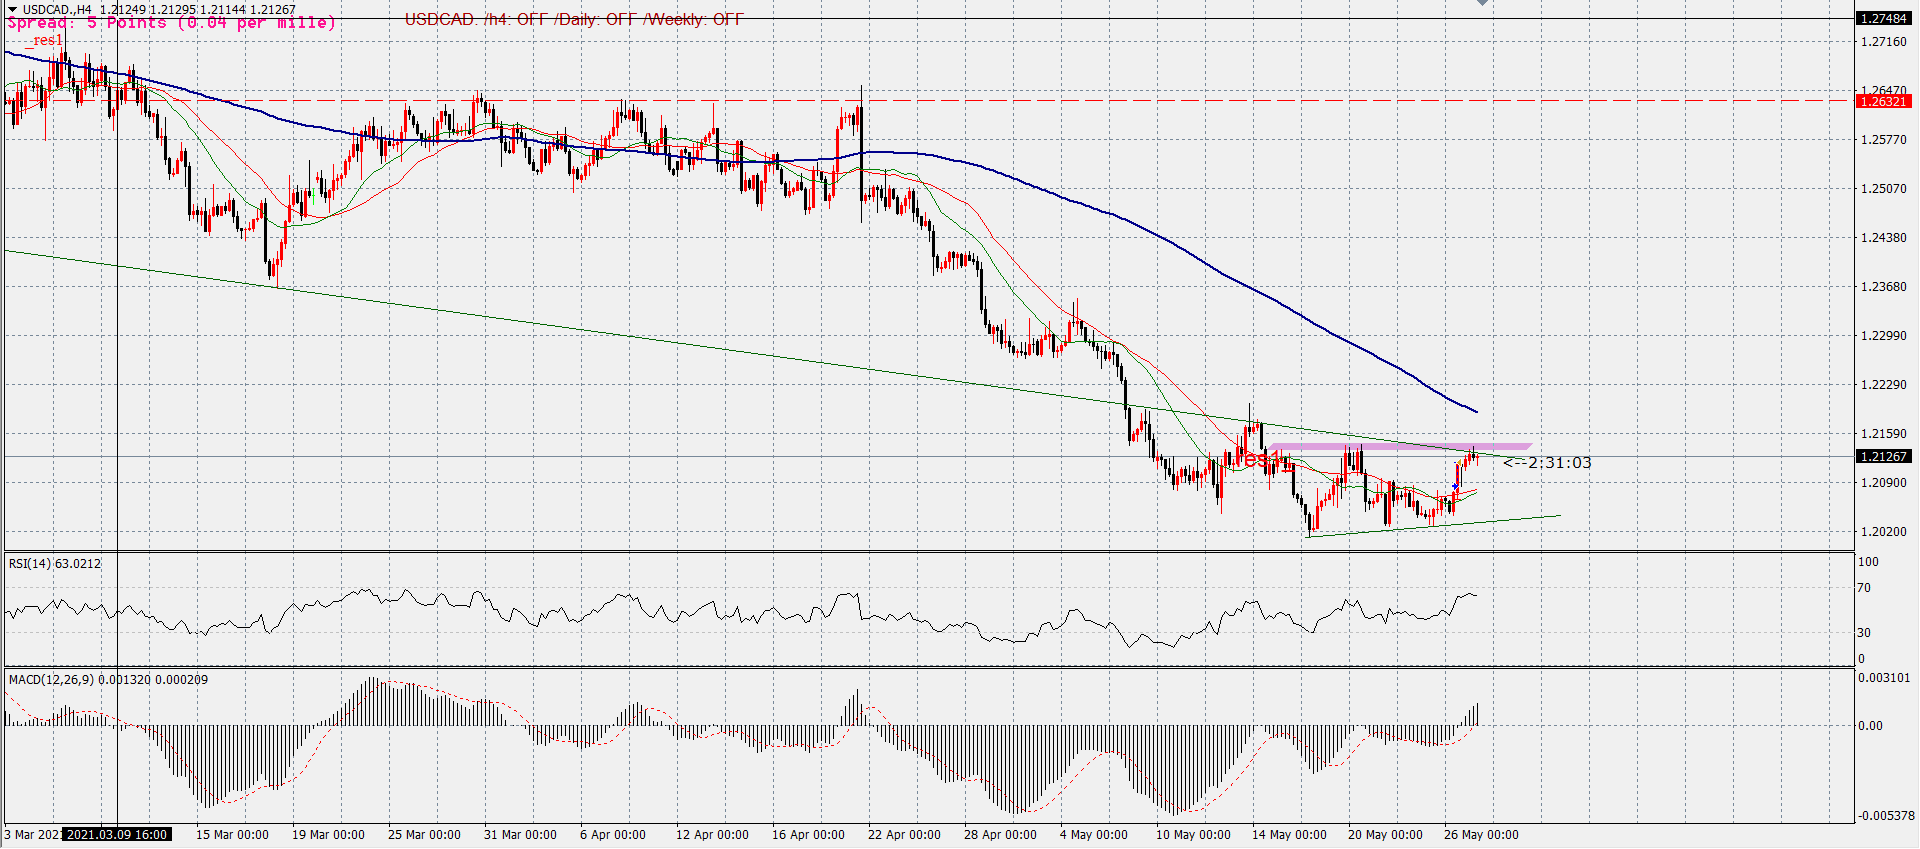
According to the chart, the price is near the resistance level of 1.2144. If this level is broken, you can expect an upward movement. Based on this, we act as follows
BUY @1.2150 , SL @ 1.2112 TP1@1.2195 TP2@1.2260
25 May 2021
GBPUSD
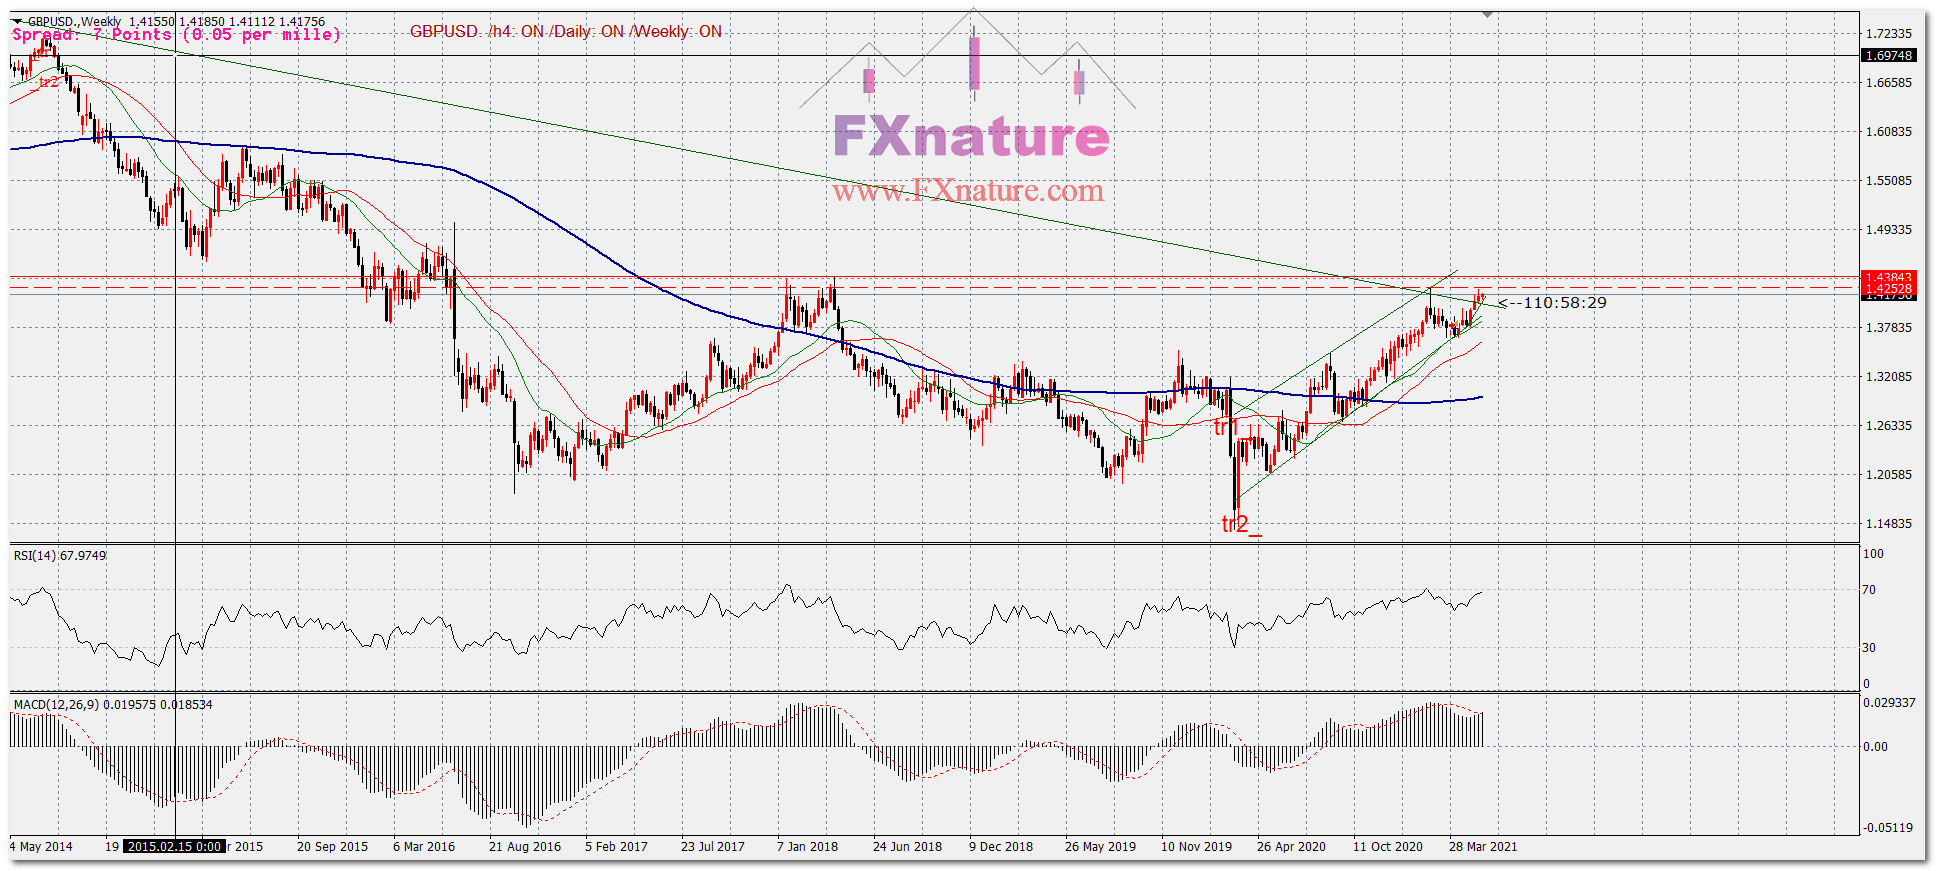
As can be seen in the weekly chart, the price is facing the resistance level at 1.4385. We expect to see a significant uptrend if this area is broken. Please pay attention price has not been able to break this level since 2016.
USDJPY
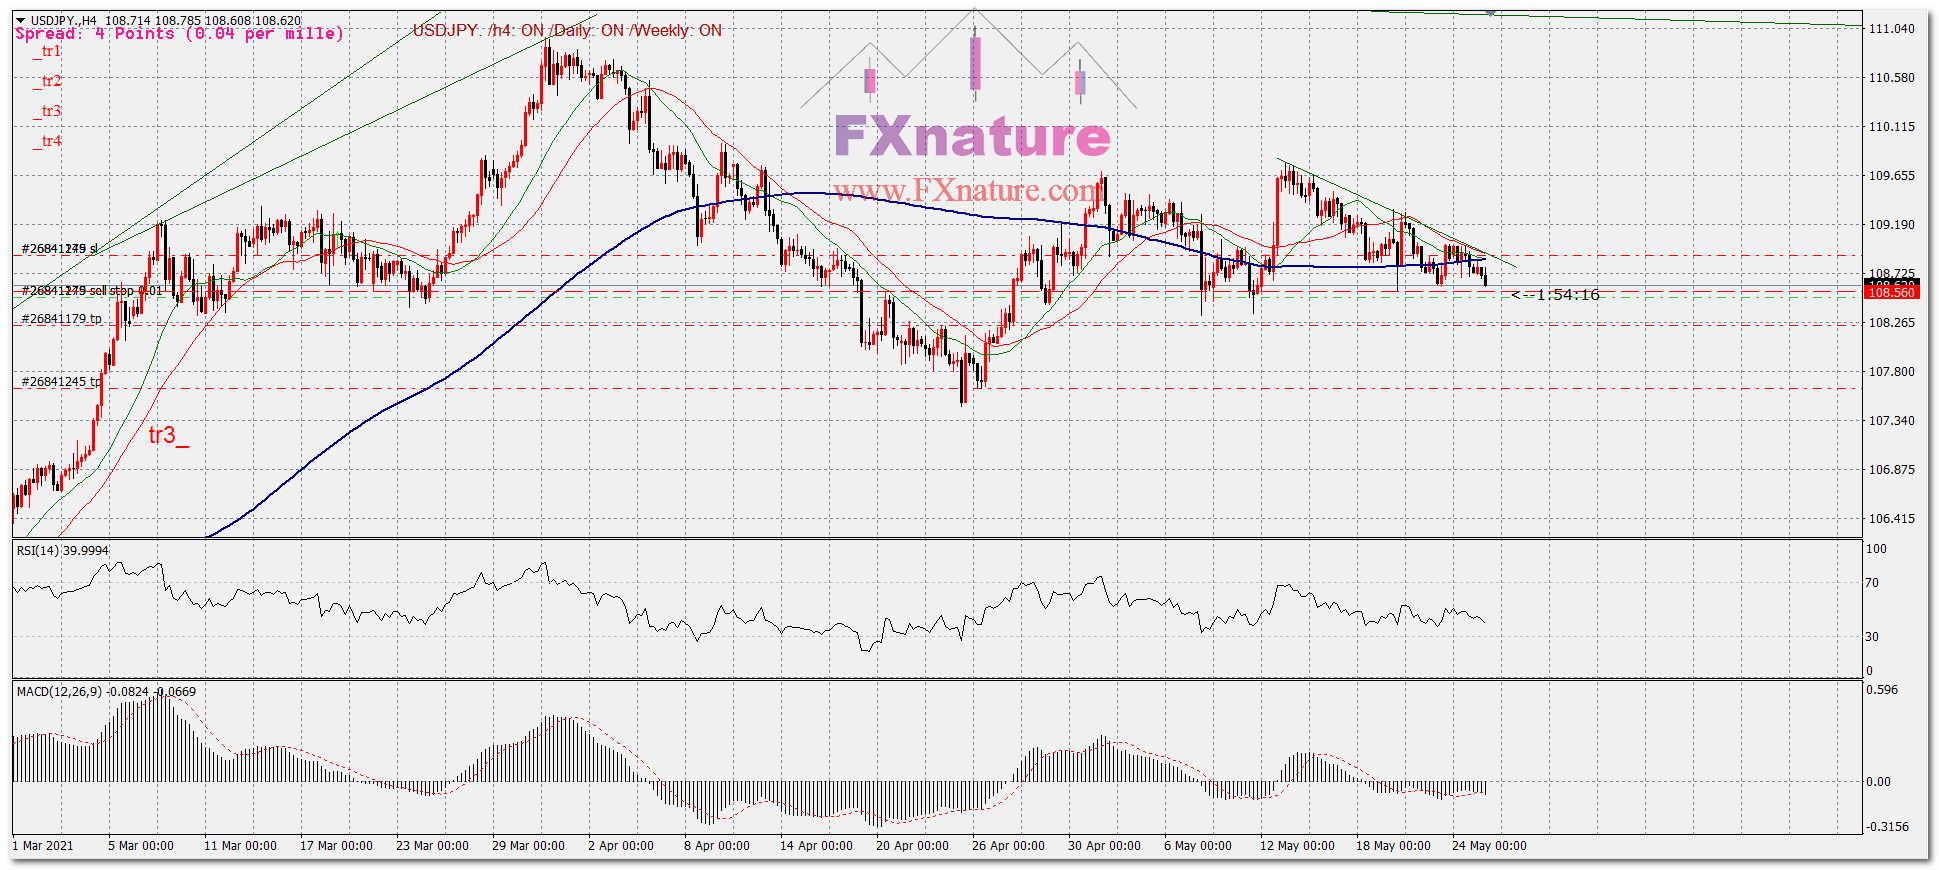
The price in the chart is adjacent to the support level of 108.55. Breaking this level could lead to a significant drop in the pair.Due to this issue
BUY @ 108.50 SL@108.90 TP1@108.20 , TP2@107.64
