forex technical analysis
17 May 2021
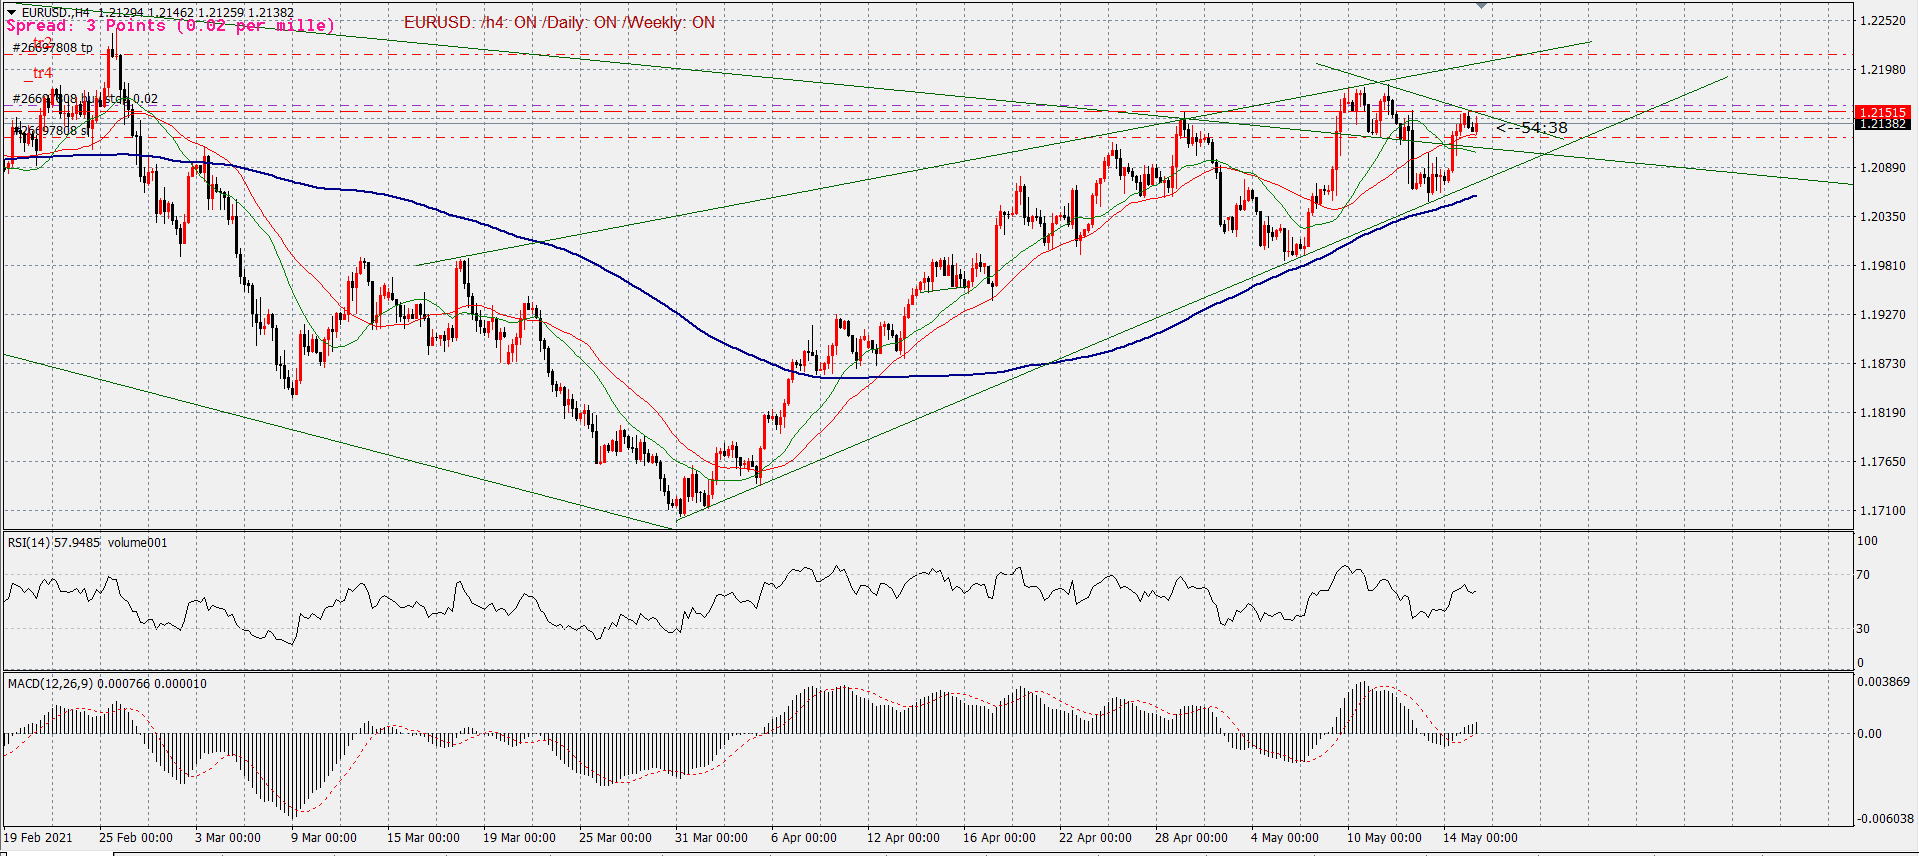
H4 Time frame EURUSD
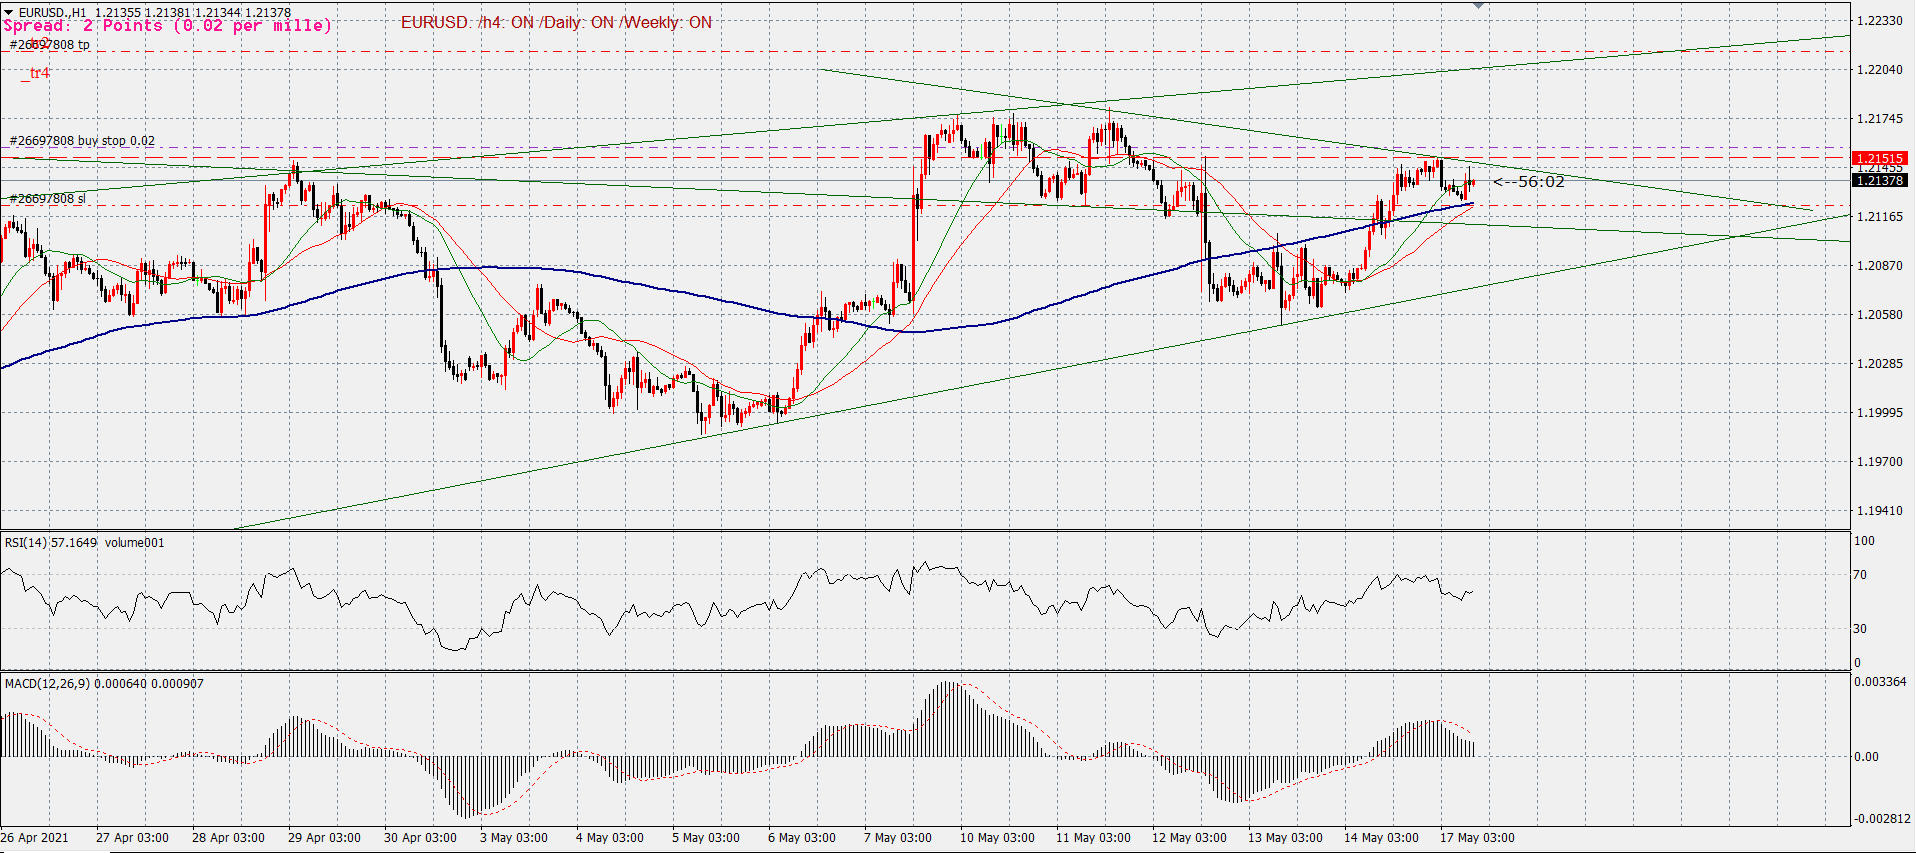
H1 Time frame EURUSD
As can be seen in the 4-hour chart, the price is on the rise. On the other hand, looking at the 1-hour chart, it can be seen that the price has stopped against the trend line. We expect the break of this trend line and the resistance drawn in the 1.2154 zone to have a strong uptrend. We have with the given explanations
BUY @1.2157 SL@1.2120 TP1@1.2180 , TP2@1.2210
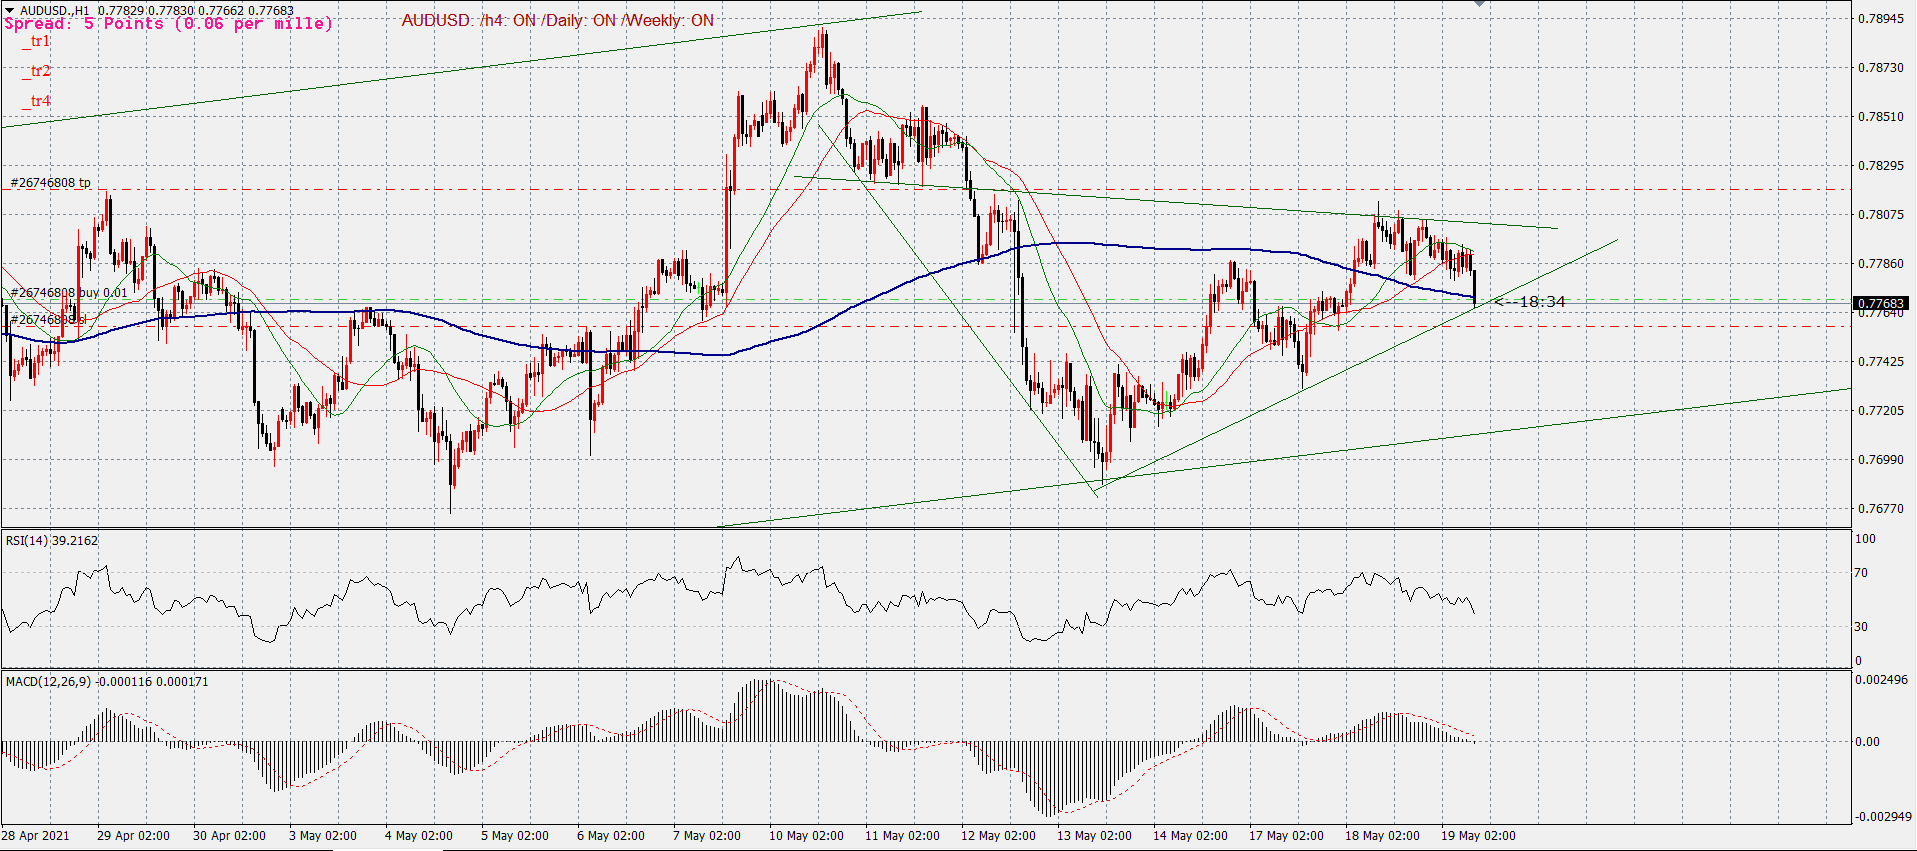
AUDUSD
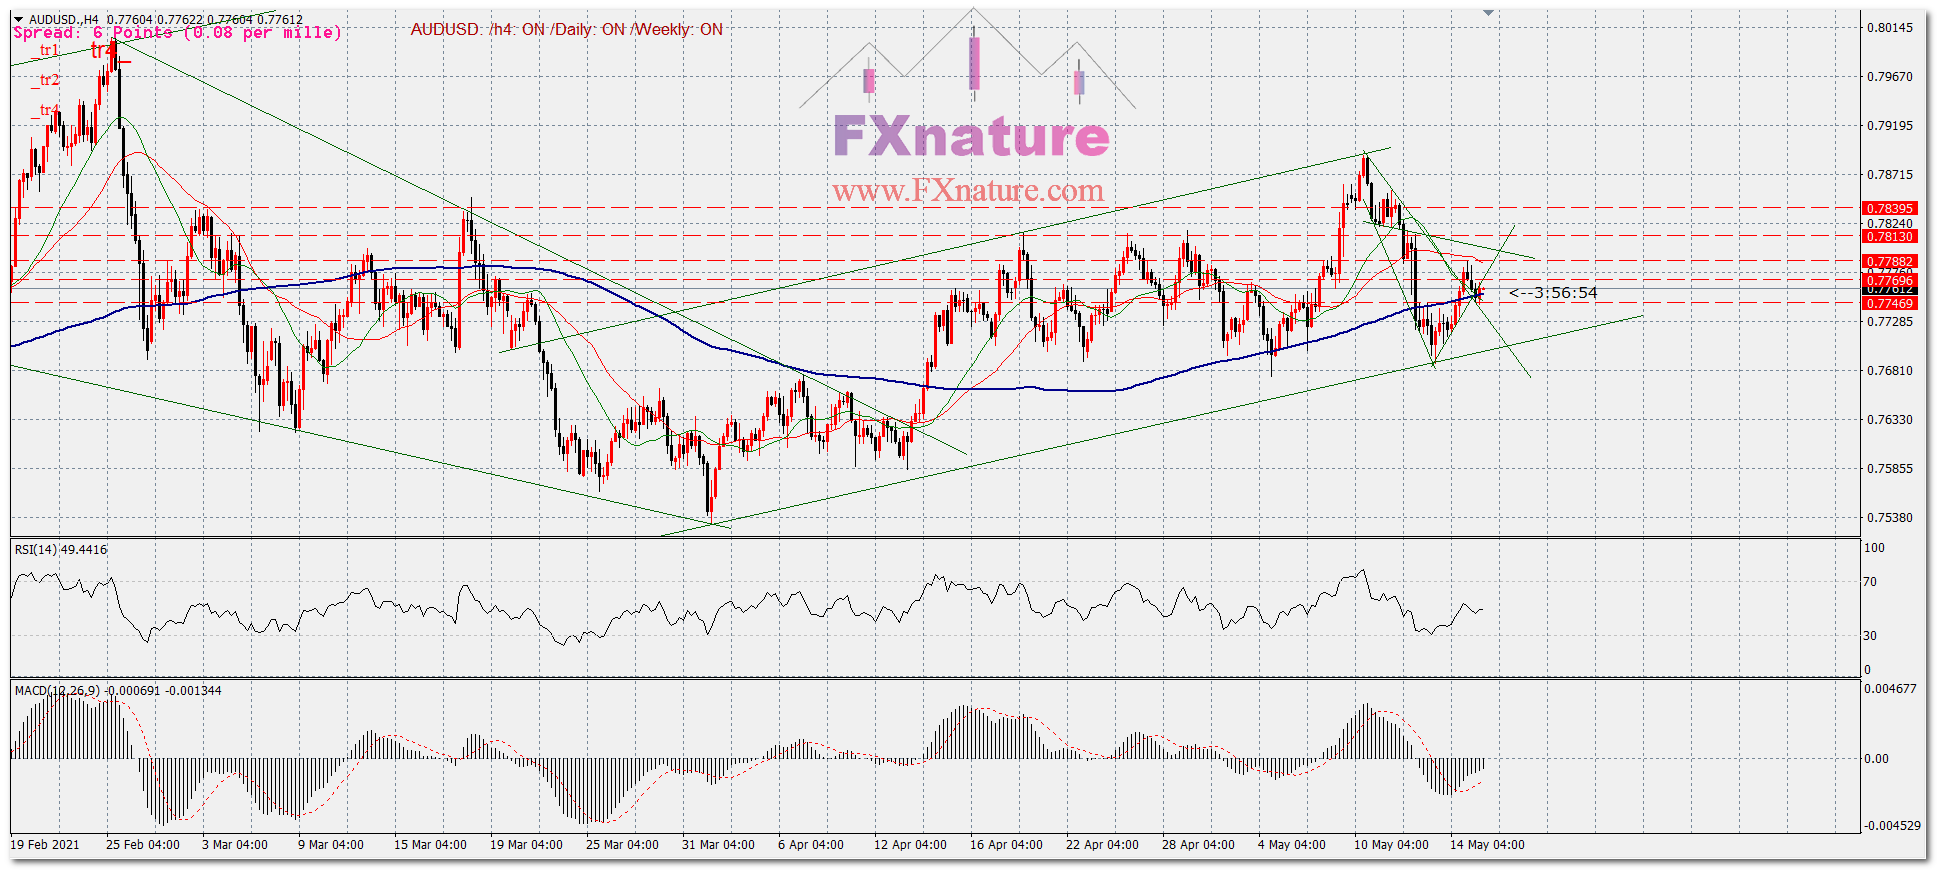
H4 time frame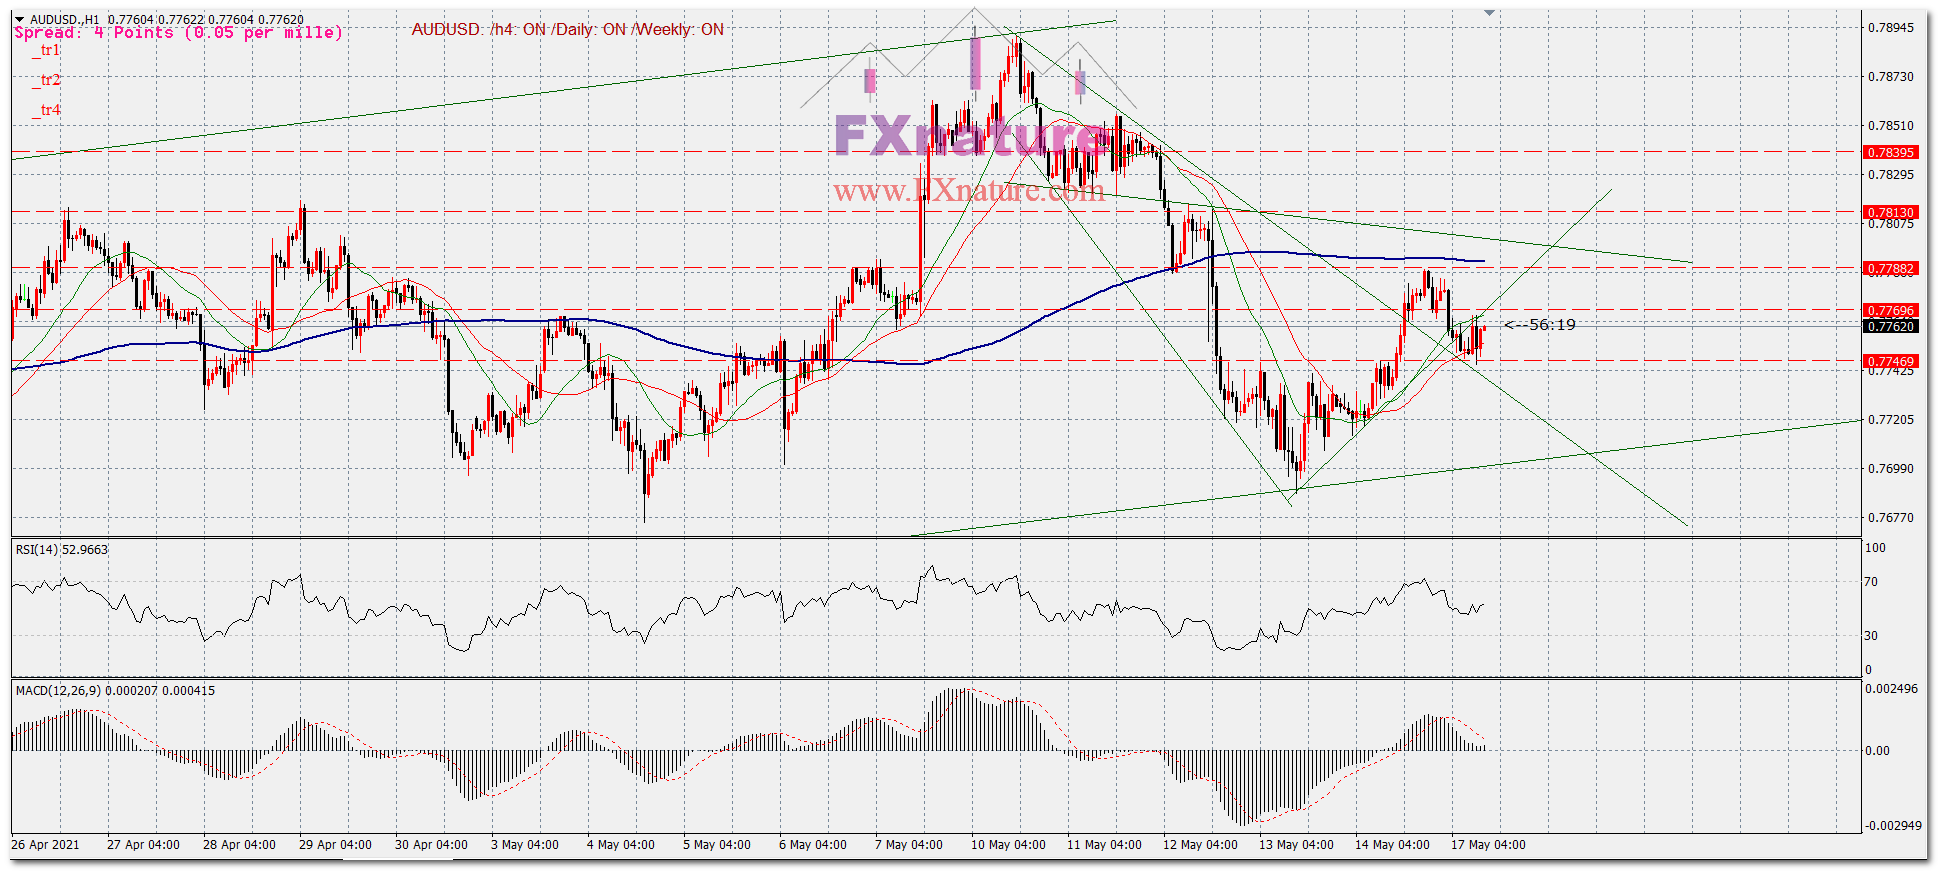
H1 time frame
As can be seen in the 4-hour chart, the price has been on an upward trend and has started to grow after hitting the bottom of the channel. Therefore, we expect an upward movement to the top of the channel .Moreover according to the hourly chart, we expect with breakout at 0.7770 show an up trend toward the targets.So
Buy @ 0.7772 SL@0.7742 TP1@0.7790 TP2@0.7810 TP3@0.7840
18-May-2021
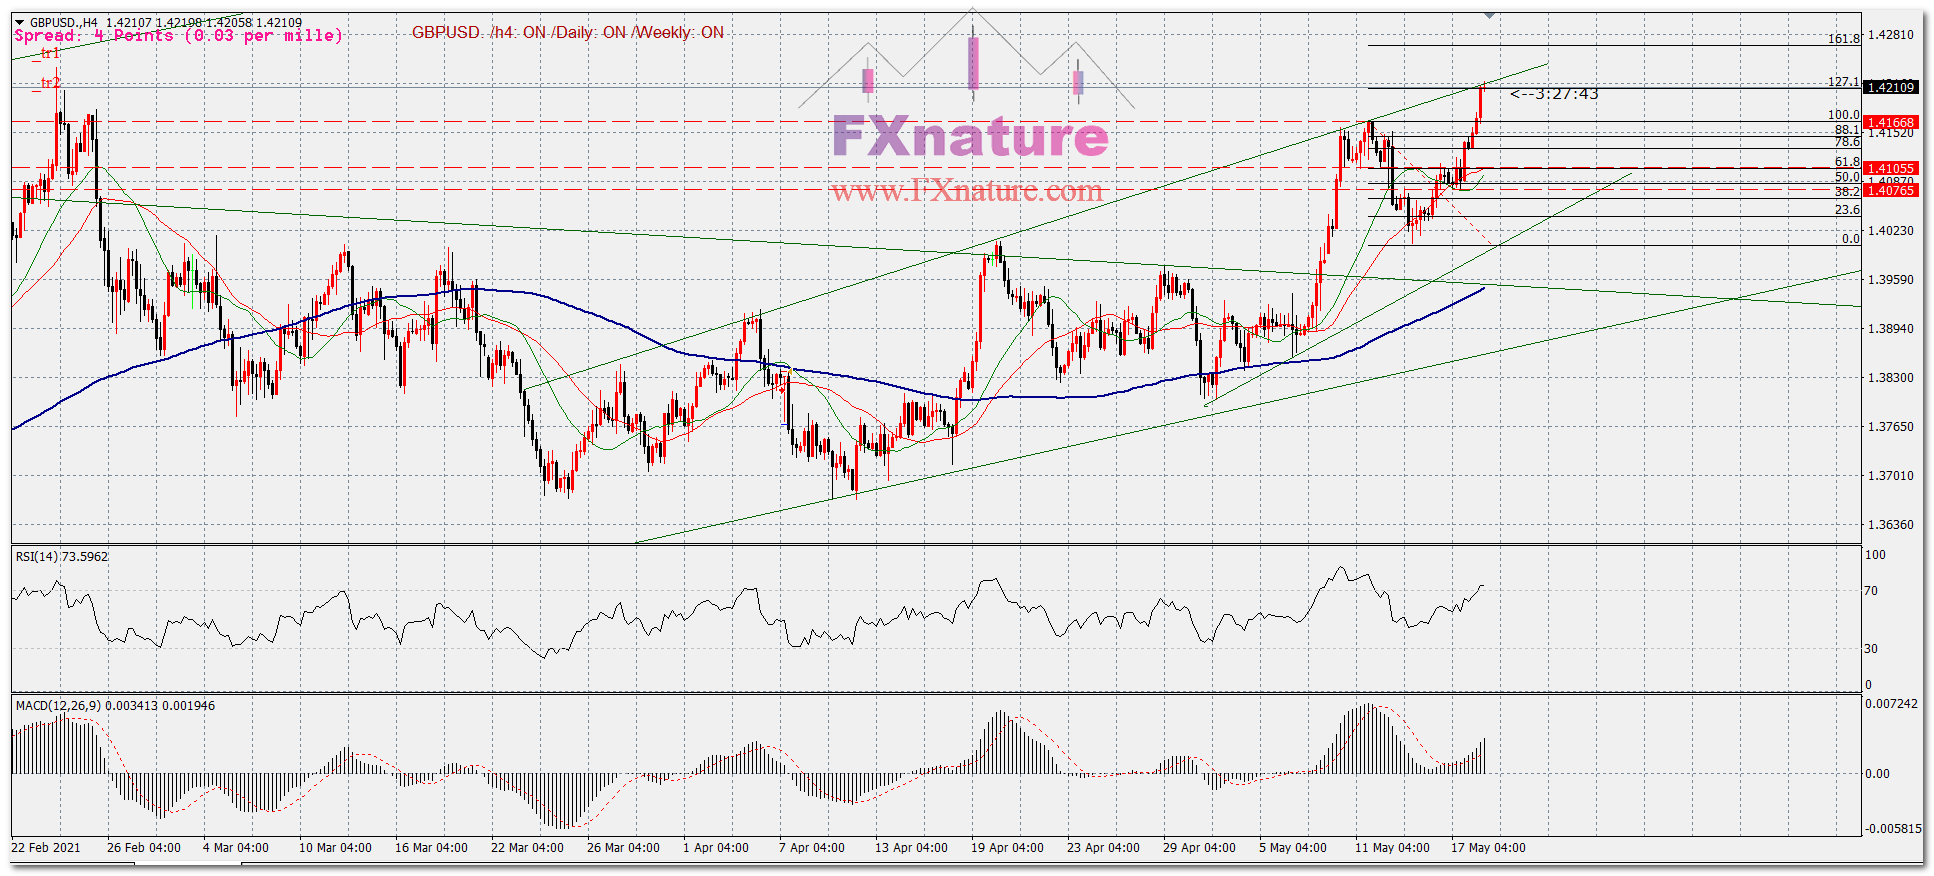
GBPUSD
As can be seen in the chart, the price is at the TOP of the drawn channel. This price is at the same time with the level of 127% Fibonacci. Another very important point is the possibility of divergence at this level in both the indicator MACD and RSI. Hence a very good short opportunity can be imagined. But recommended until short signal appear and short after that.
19-May-2021
USDCAD
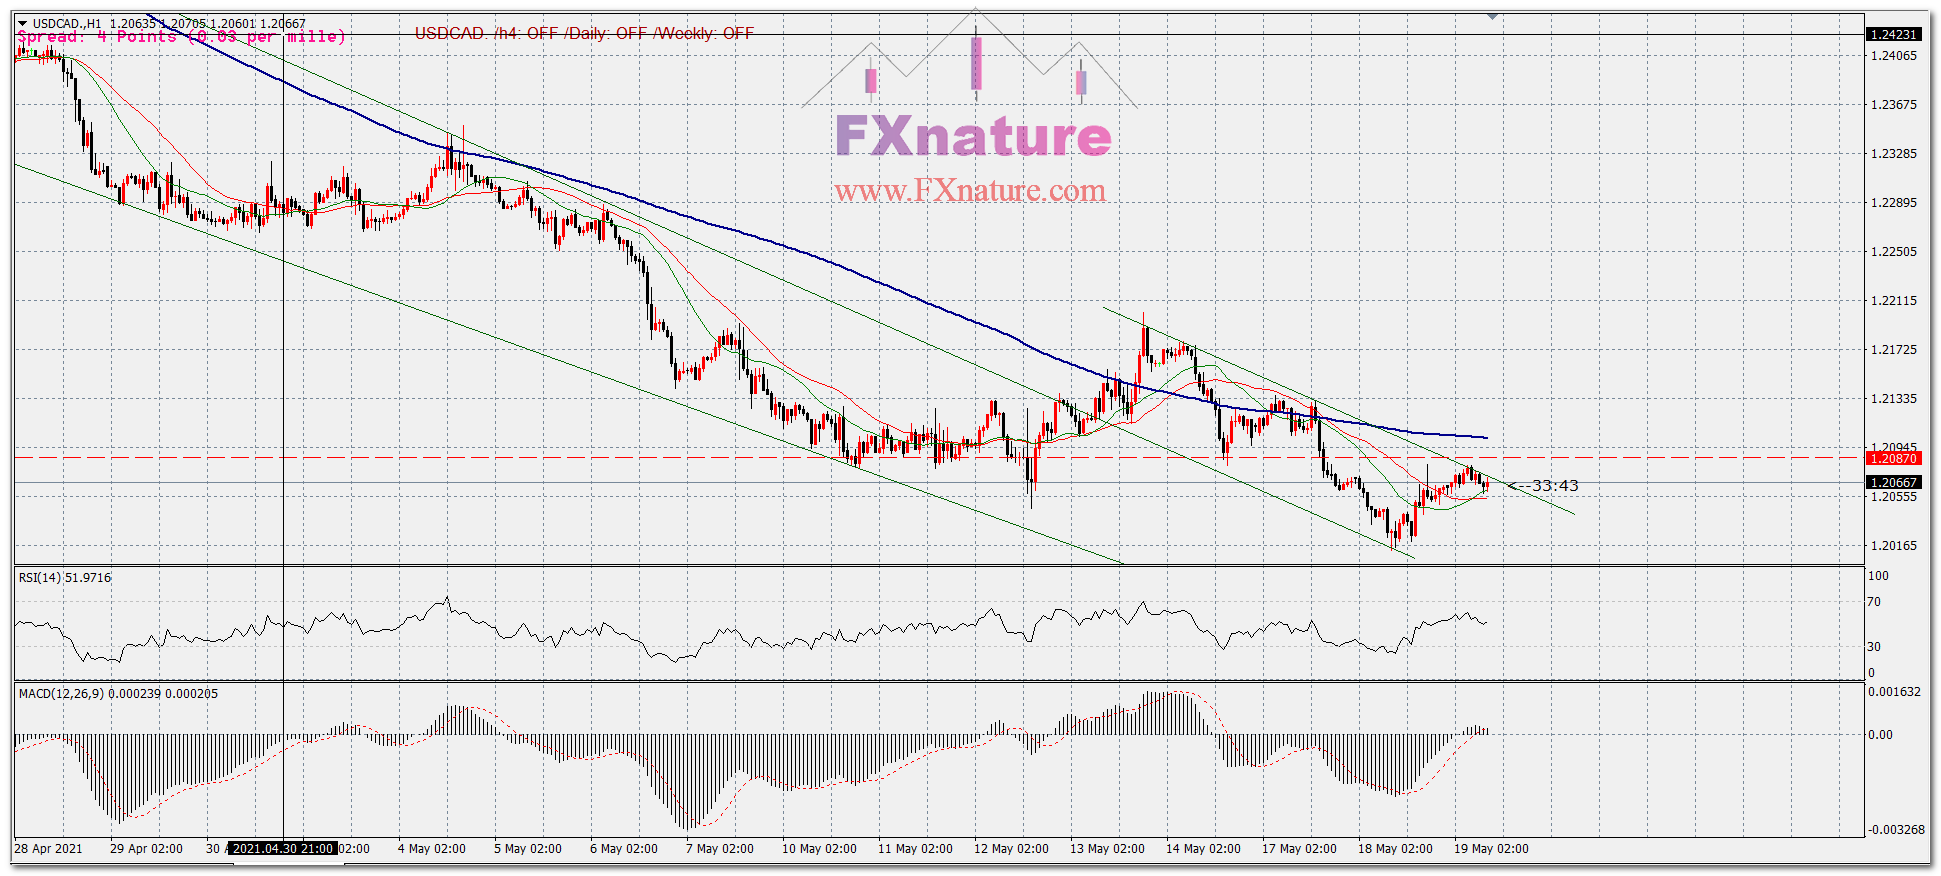
As can be seen in the chart, the price broken the previous channel and is in new channel which is formed parallel to the previous channel. The price in this channel is also decreasing. We expect the breaking of the second channel(upper line) to be accompanied by a change in price direction and upward movement. With these conditions, the long signal is as follows
buy @ 1.2090 SL @ 1.2055 , TP1 @ 1.2130 , TP2@1.2175 , TP3@1.2195
AUDUSD
TIME H1
The price in AUDUSD chart has hit the trend line. This signal has a high risk. Therefore, it is recommended to enter with a low volume. The stop loss is placed below the trend line. Please be careful
buy @ 0.7766 SL @ 0.7756 TP1@0.7808
EURNZD
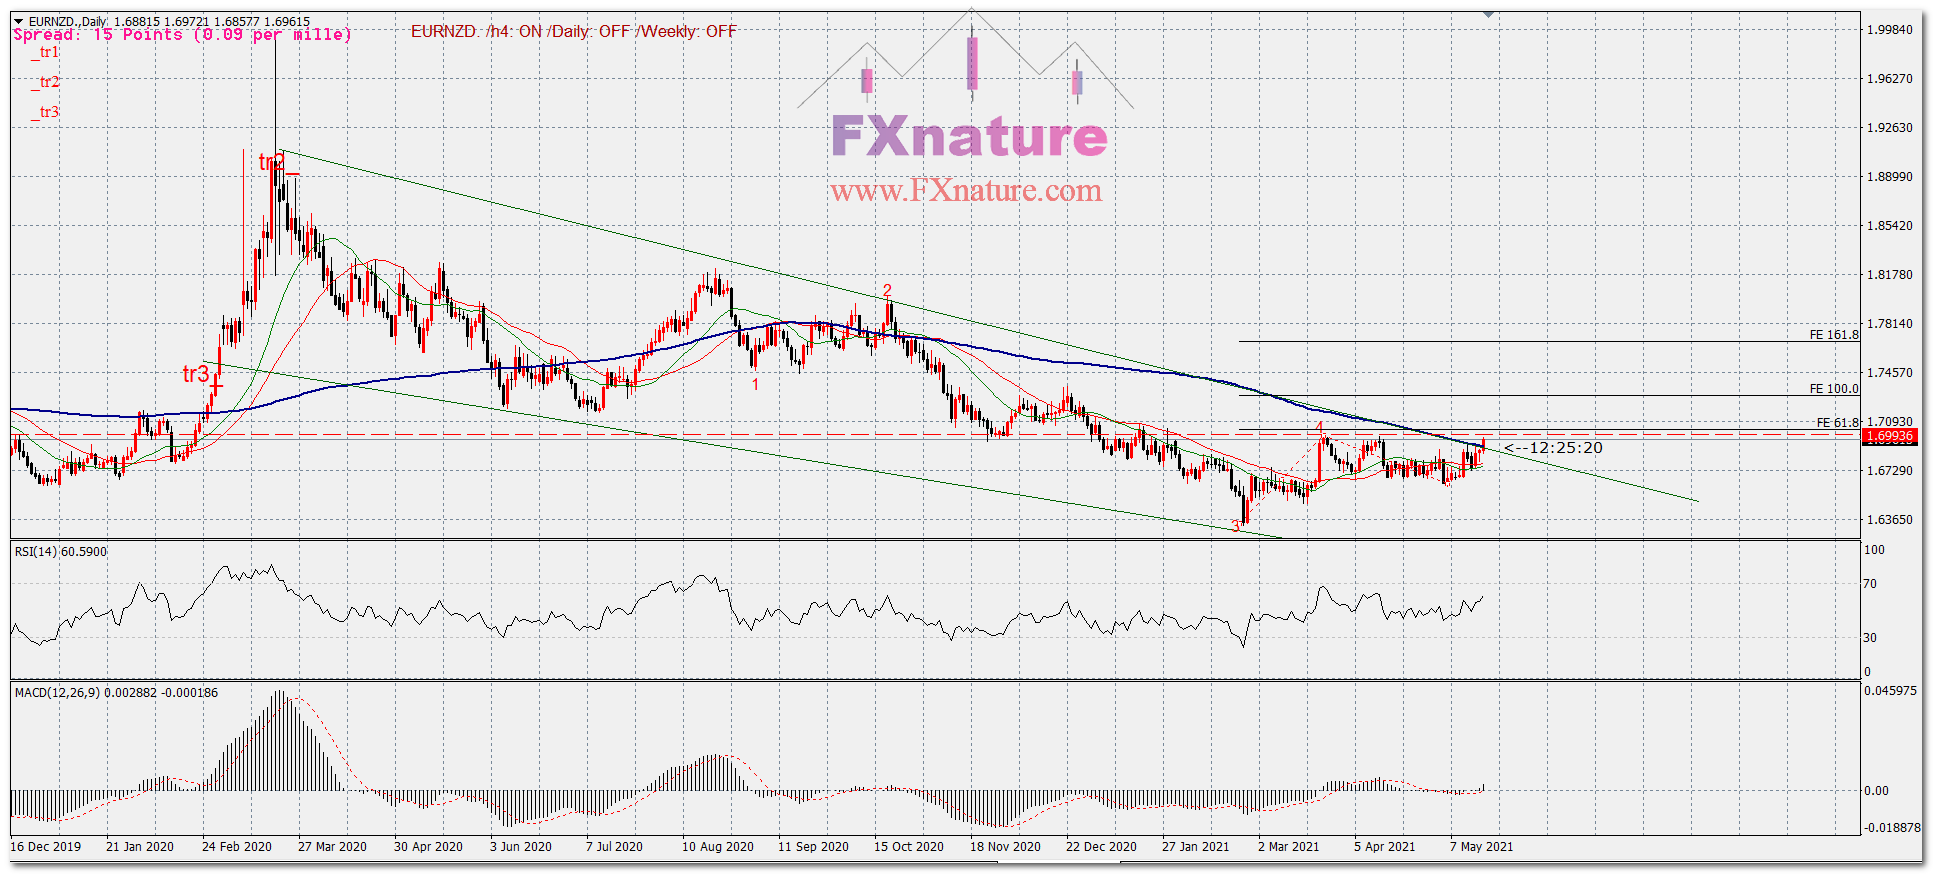
Daily EURNZD
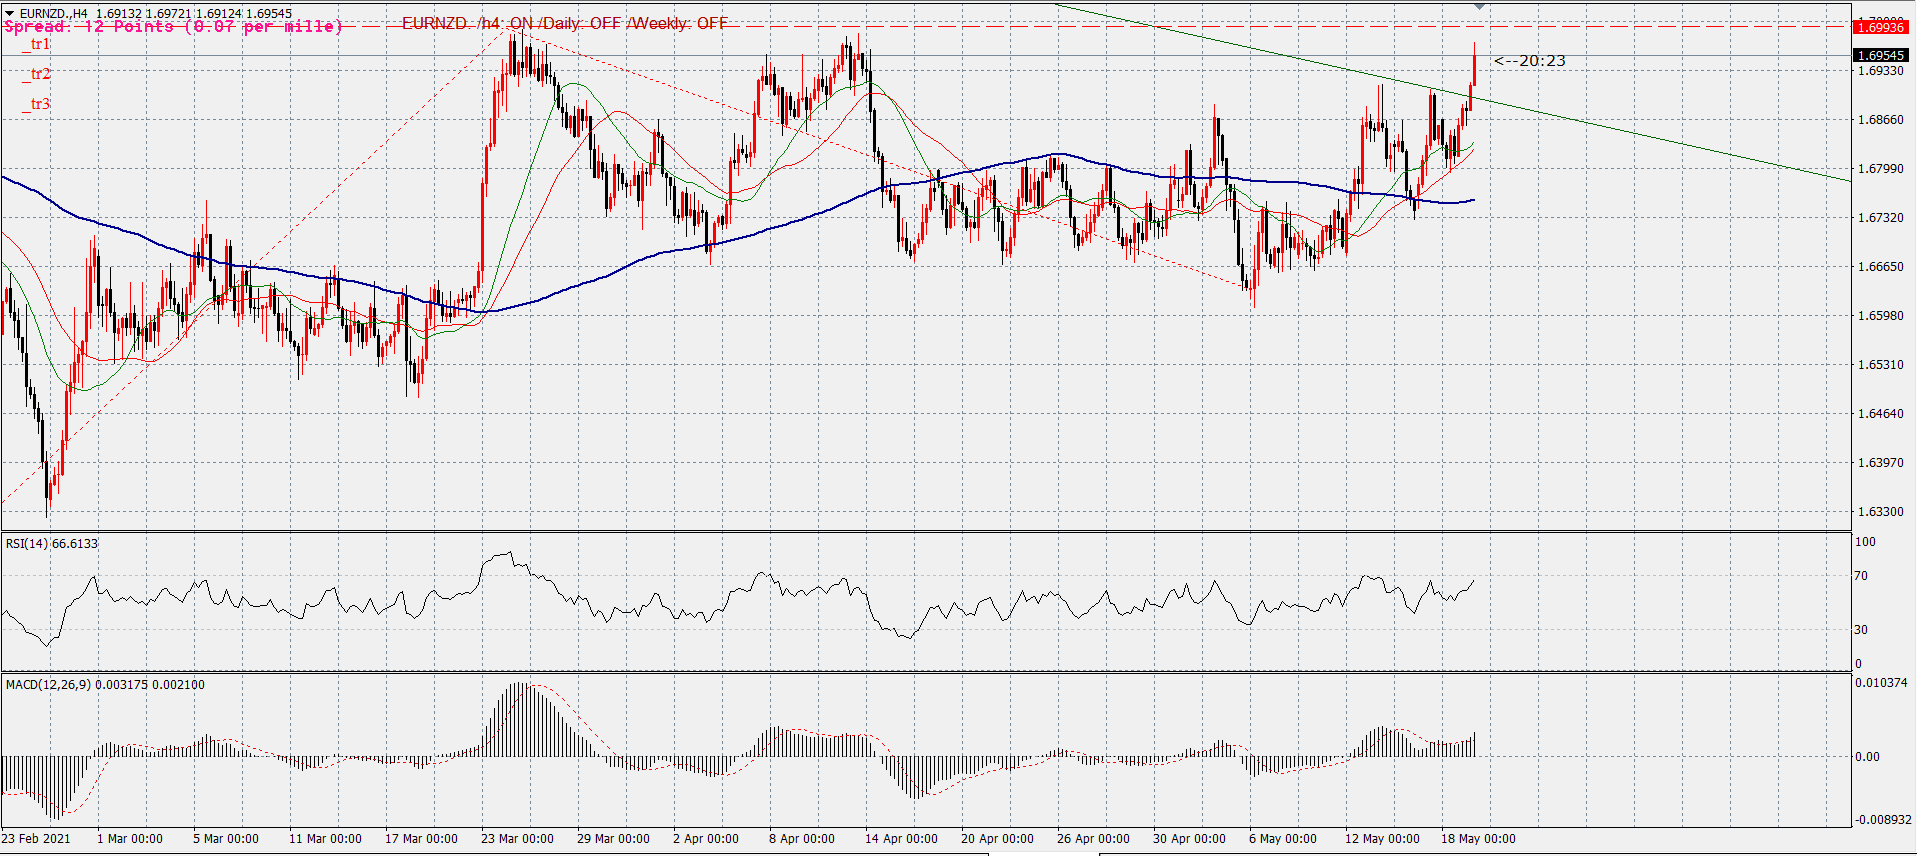
H4 EURNZD
According to the EURNZD chart , price is breaking upper line of channel . Then there is resistance at the level of 1.7000, which is expected to sharp move when price break out that level . Based on mentioned points
buy @ 1.7005 sl 1.6870 tp1@1.7300
Please pay attention this position is long term with big stop loss. So money management is important