
Analysis for 10 MAY
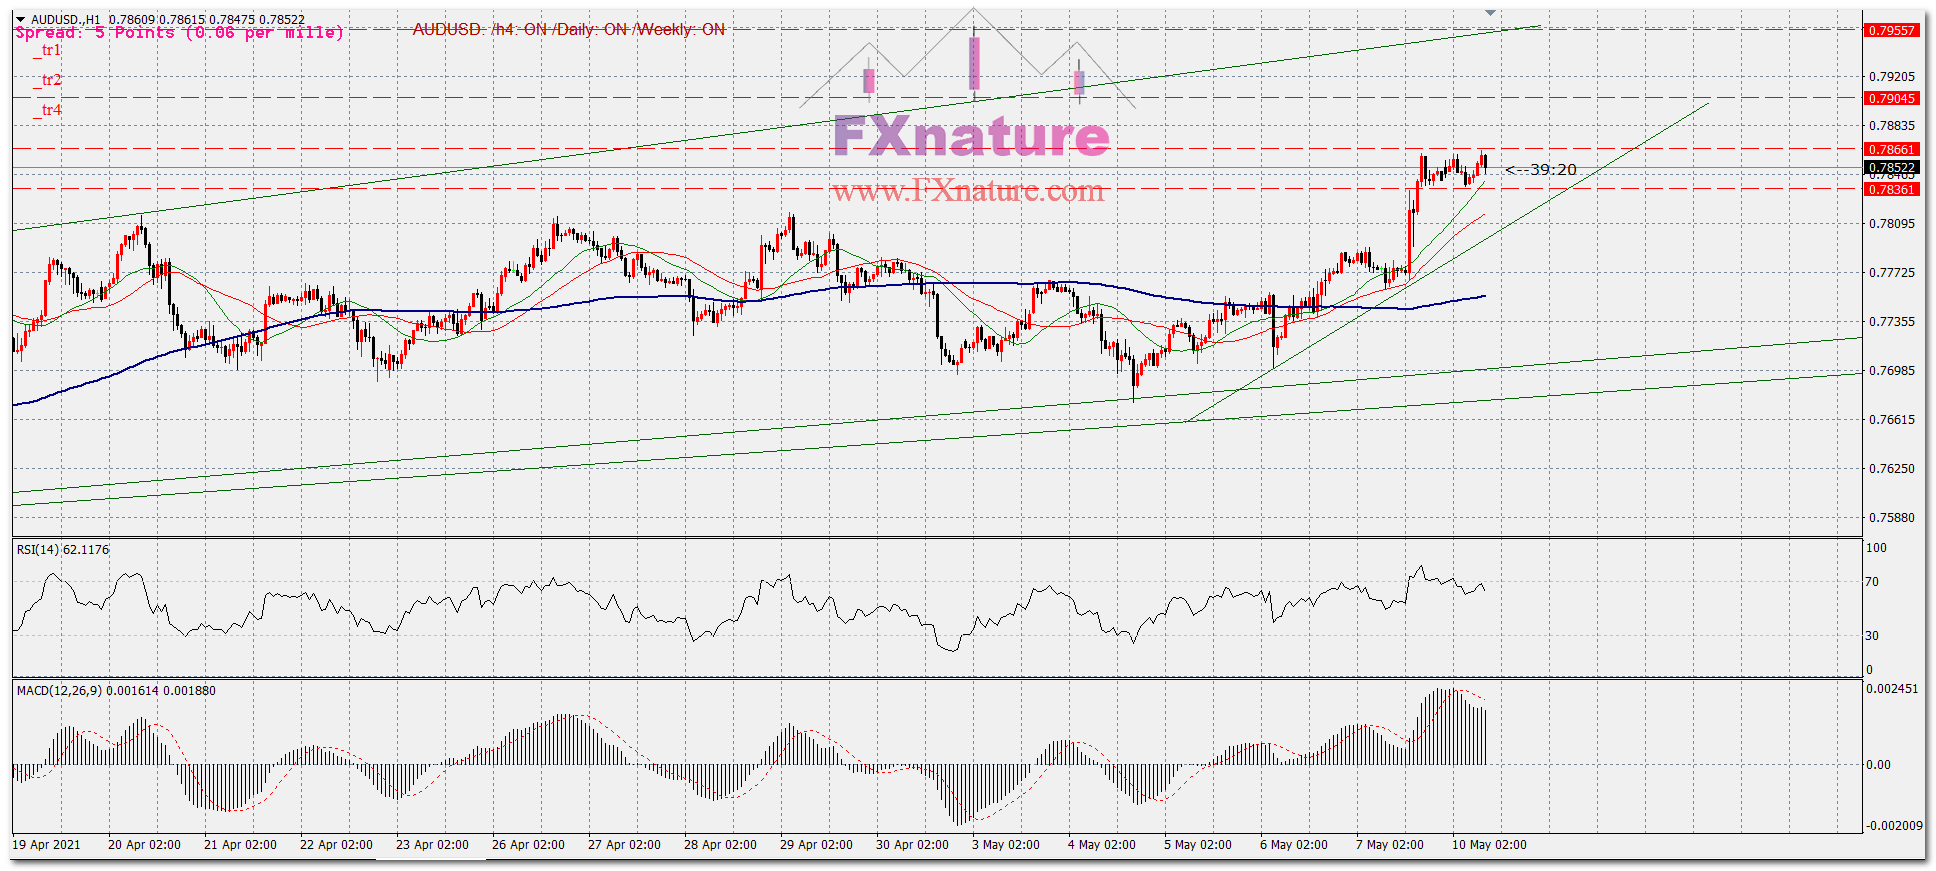
As you can see in above chart we have a RESISTANCE IN 0.7867. This is a good opportunity for but after breaking this level . with this conditions and indicator signal and Heatmap of AUDUSD we can buy@0.7870 SL@0.7835 and TP1@07900 , TP2@0.7950
11 May 2021
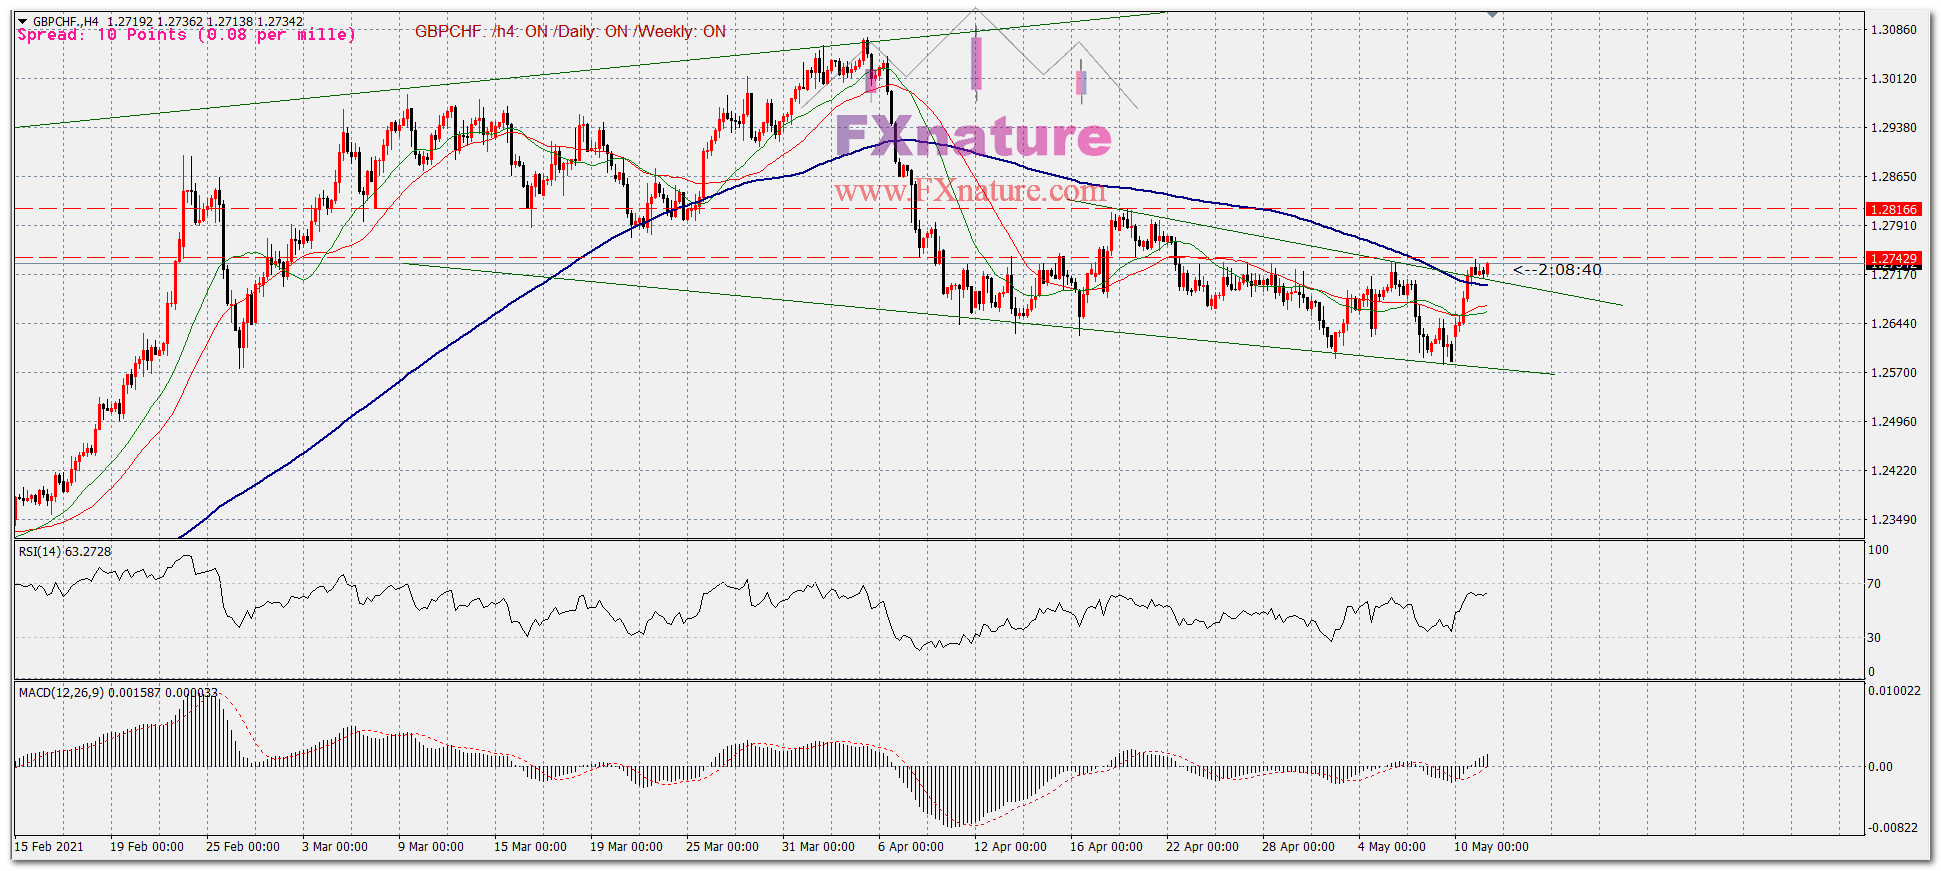
As can be seen in the chart, the price is in the vicinity of the resistance level of 1.2743. In addition, as seen in the 4-hour chart, the trend line is broken and we have pullback to it, so by breaking the resistance level at 1.2743, we can enter the long trade.
buy @ 1.2743 st@1.2702 and tp1@1.2765 tp2@1.2800
12 May 2021
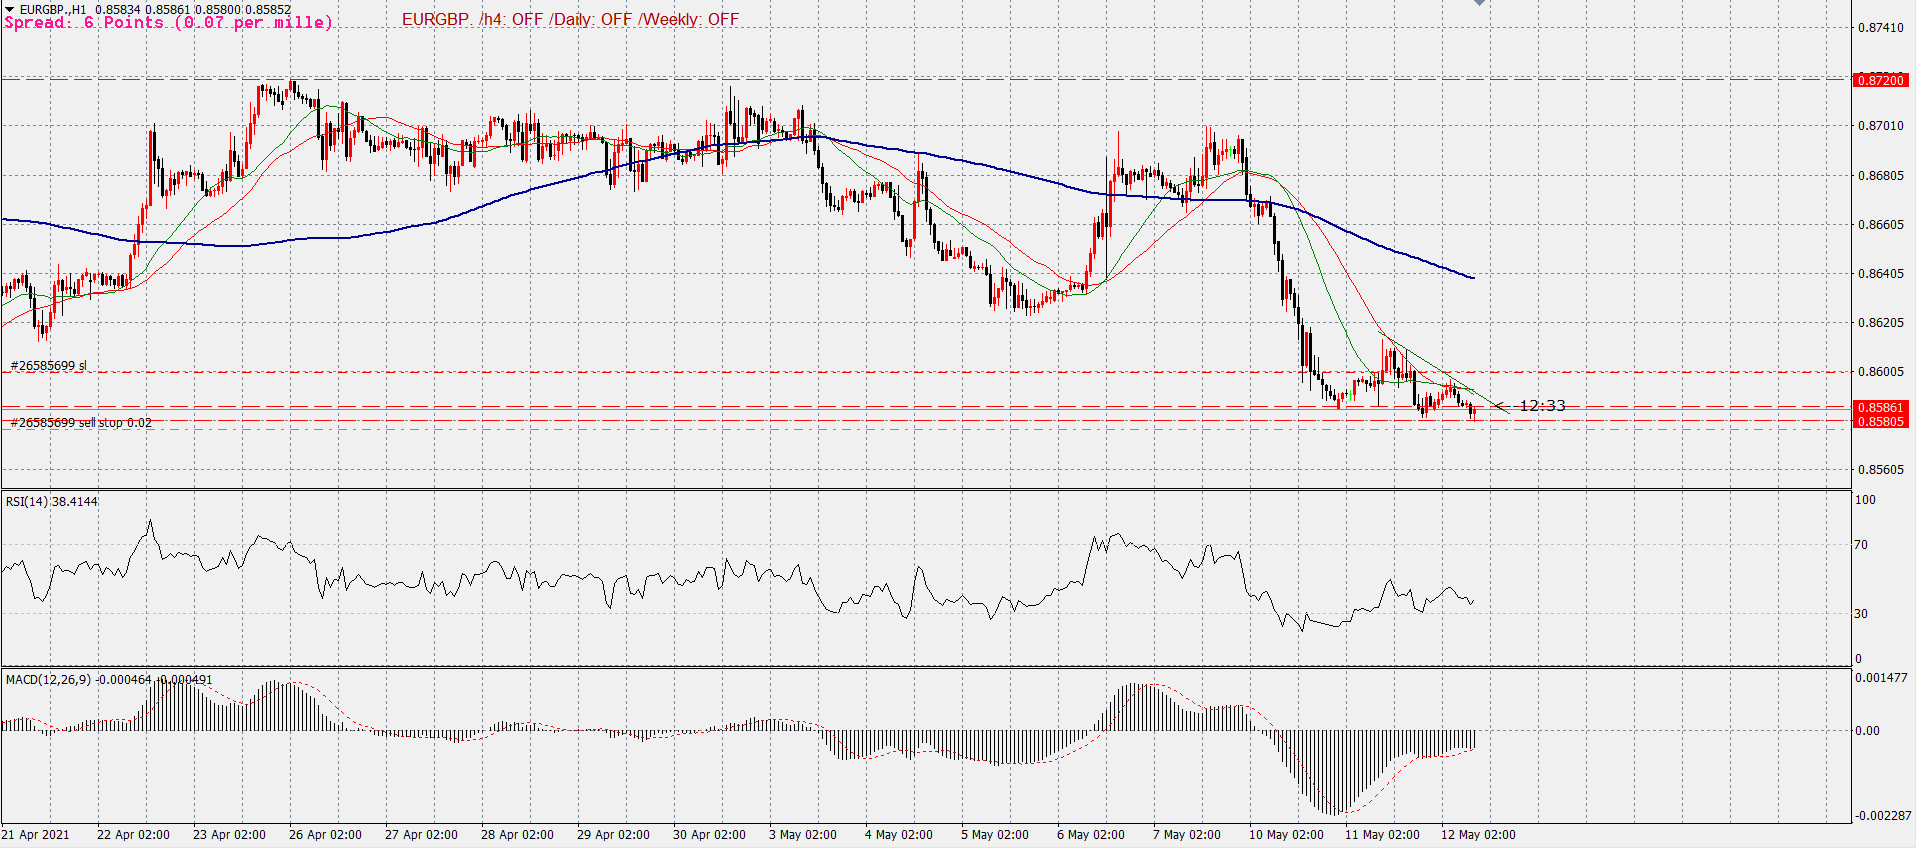
As can be seen in the EURGBP H4 chart, it is falling and has been in the support range of 0.8580 for almost a few days. We are expected to enter the SHORT deal when this level is broken.
