
17 May 2021
BTCUSD Analysis
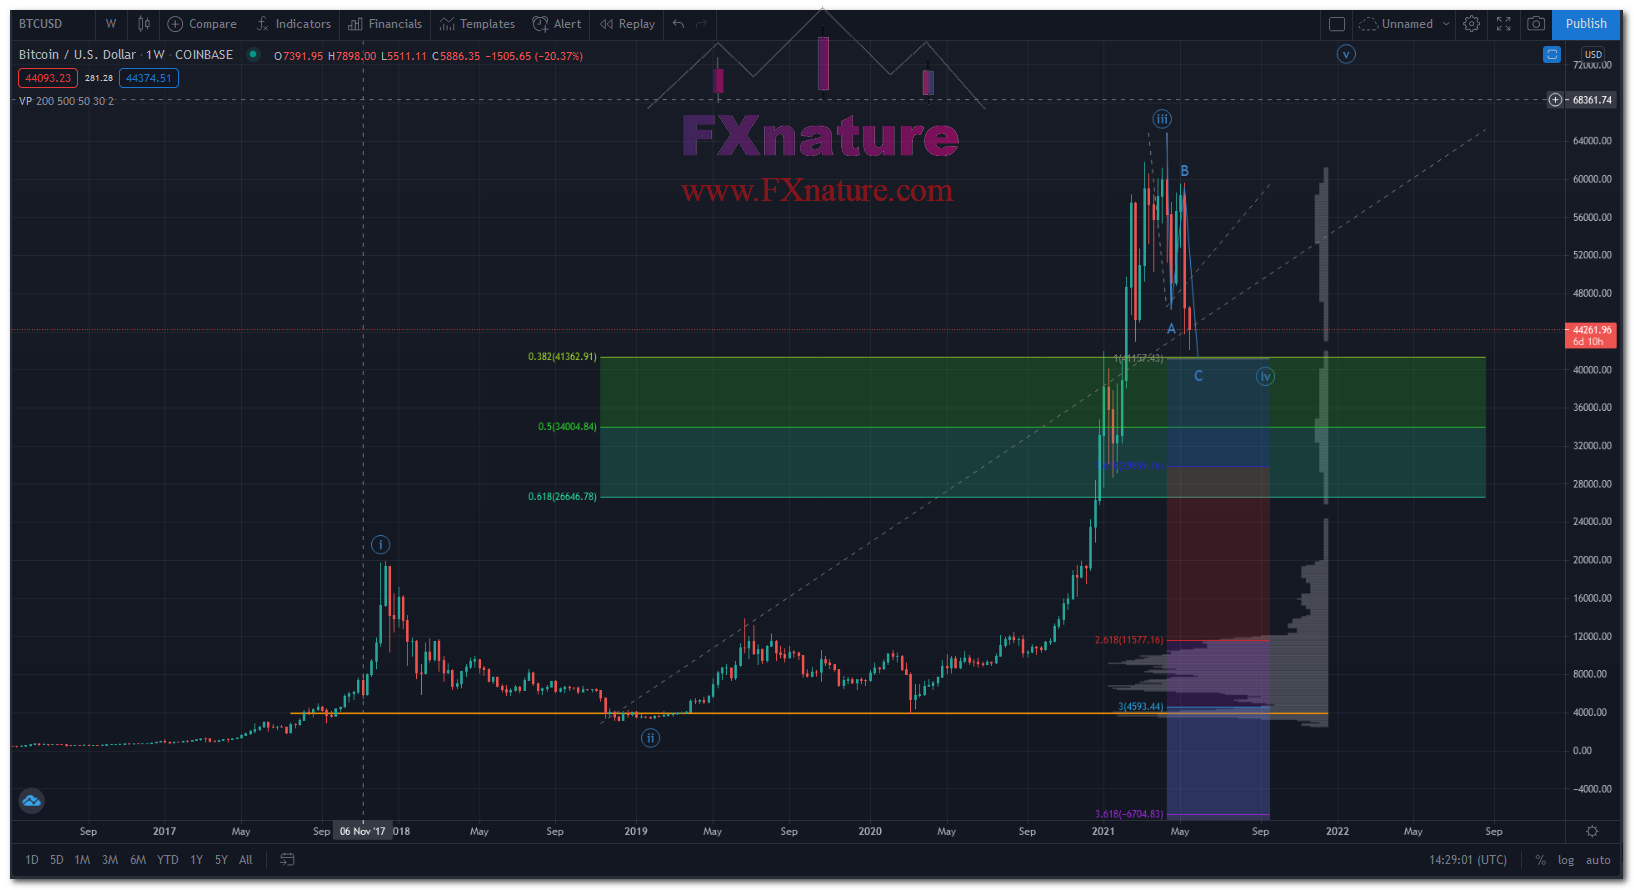
As shown in the weekly chart of Bitcoin to the dollar, we see the counting of Elliott waves. Wave 4 is now over. The end of wave 4 Elliott is 38.2% of Fibonacci ratio of wave 3. In addition, Wave 4 is zigzagged, with a 100% level with a 38.2% Fibonacci level forming a price cluster. Therefore, the beginning of the ascending wave 5 can be considered probable and the ascent is probable
What is the recommendation for this crypto currency?
At the moment, according to your circumstances, it is not for sale and they seem to have stronger buying opportunities. This is true as long as the price does not fall below the 38.2% Fibonacci level at $ 41360 and the price stabilize below this level.
19-May-2021
XRPUSD
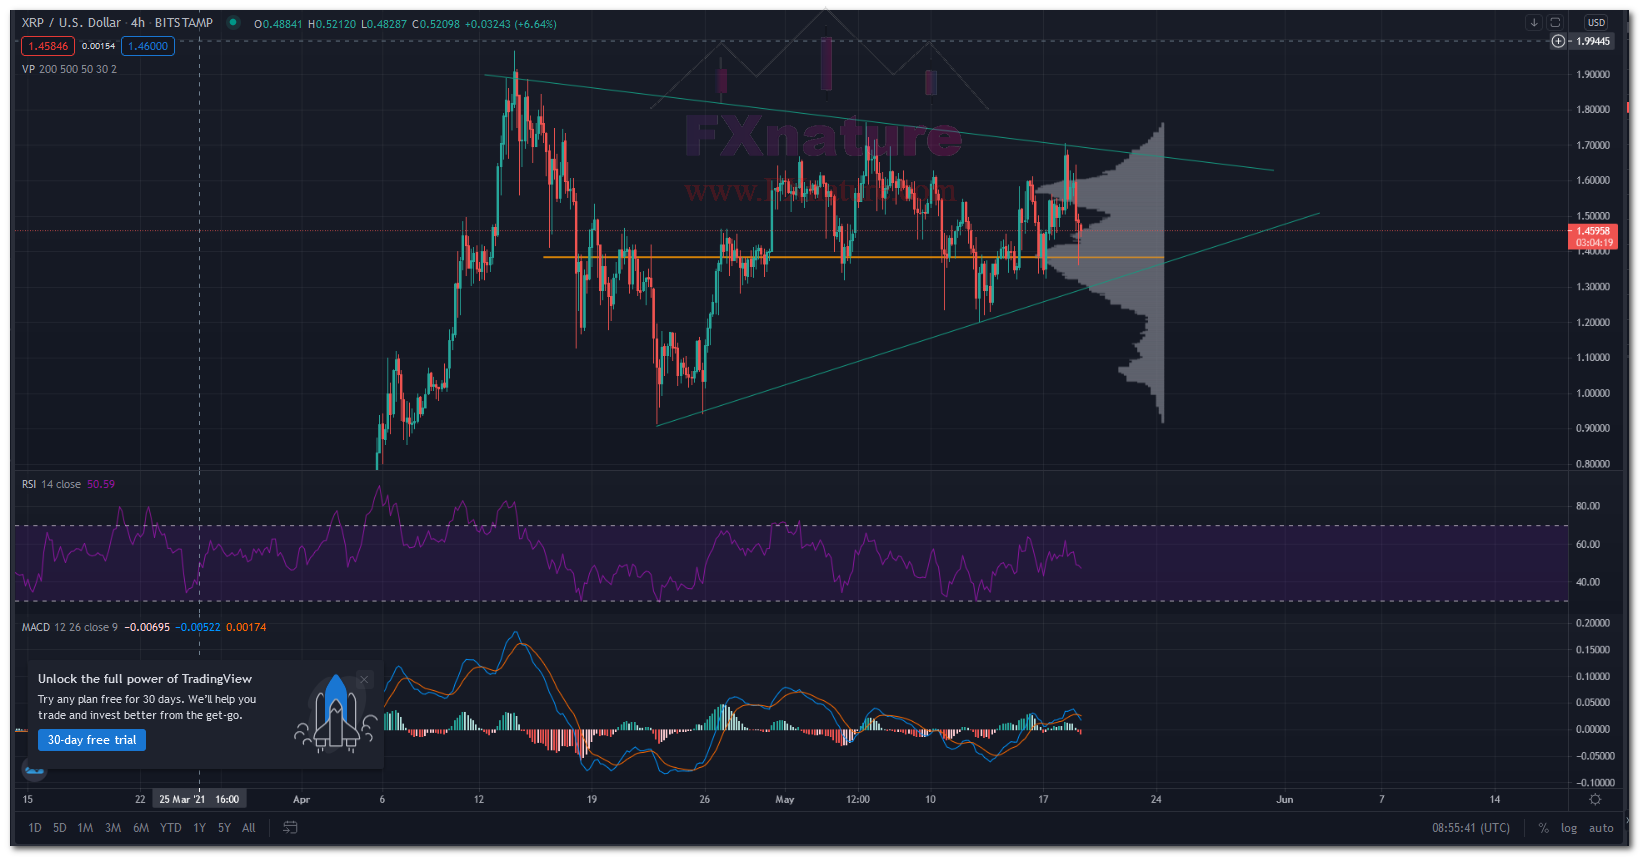
As can be seen in the Ripple chart, price is forming a triangular pattern. As we know, the triangle pattern means of gathering market energy and then volatility in one direction. Although it is more likely to continue the trend in up direction , but failure and break out from bottom of the triangle should not be considered unlikely. According to these conditions, you can buy at the bottom of the triangle with a suitable stop loss . Also, breaking any sides of the triangle in any direction can be traded.In any situation passing price from 1.1900 is a strong signal for falling price so in any trade use this level for stop loss.
BTCUSD
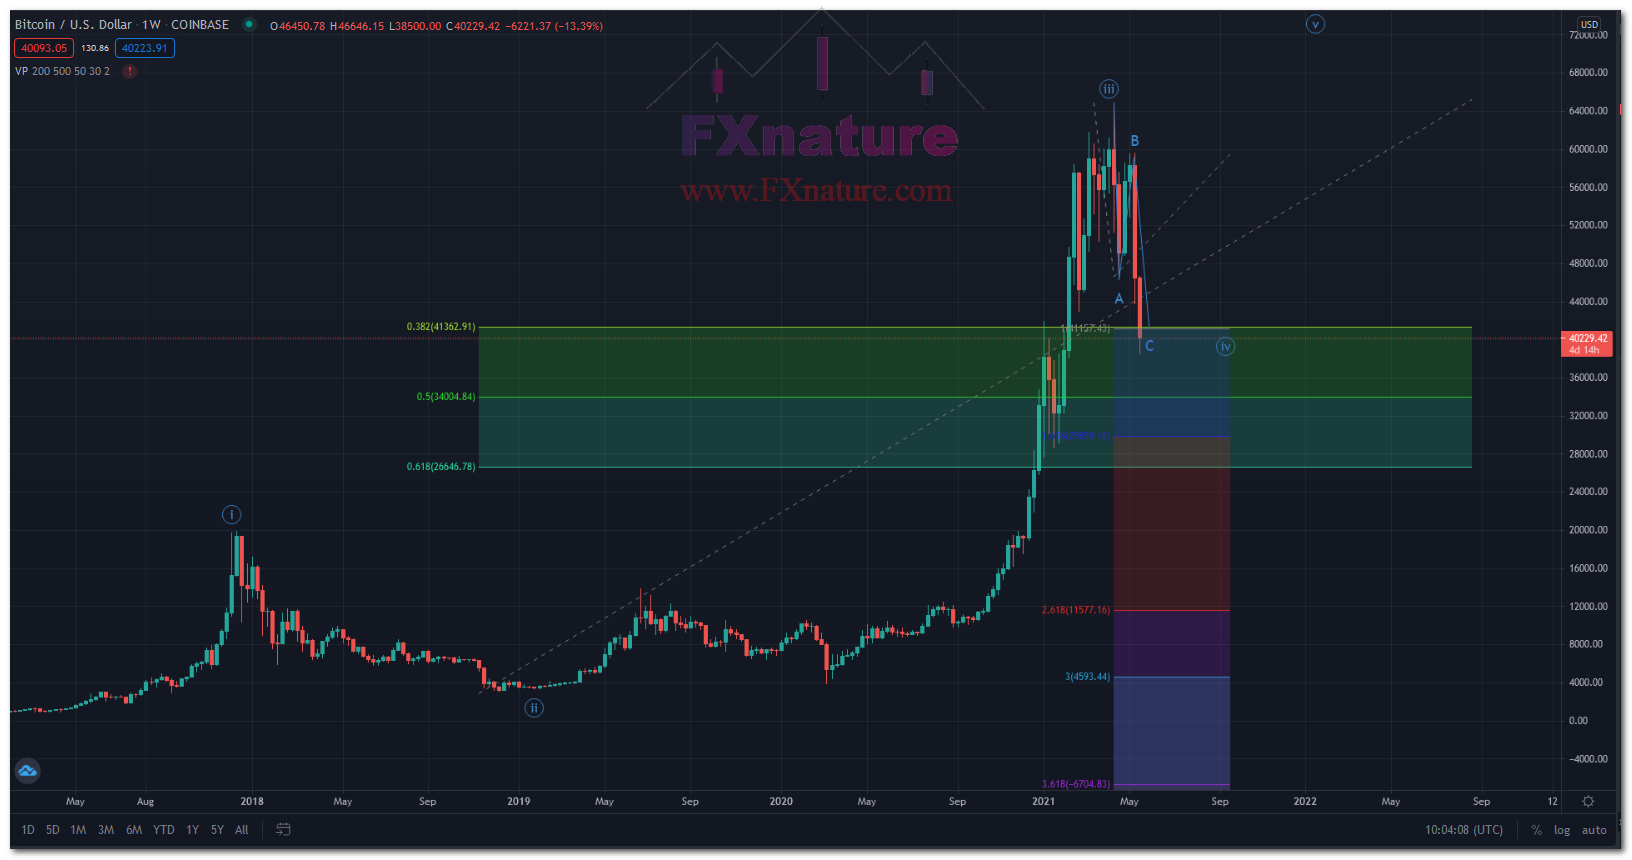
With the fundamental news appearing in the cryptocurrency market, we saw a terrible decline in most of them. This fall was such that we broke many support levels and had very strong movements. One of these is bitcoin. The fall of Bitcoin broke the 38.2 and 100% Fibonacci levels expressed in Analysis 17 -May. In this case, we can imagine the next target, 50% Fibonacci, which is equal to $ 34,000.
