Technical Analysis Pairs
This content consist technical analysis of EURUSD , GPBUSD,GOLD,NZDUSD, AUDUSD, JPYUSD ,USDCAD pairs according our technical way
Our Technical Analysis way:
Our technical analysis way is base on finding levels consist of (supports-resistance- trend lines -channels-
Fibonacci levels and …). In the first step searching for best opportunity and after finding this situations follow
signs for inputting to trades.Money Management and risk controls are very important in our way .
Risk to Reward and waiting until touch calculated targets are so important for successful.
Technical analysis AUSUSD
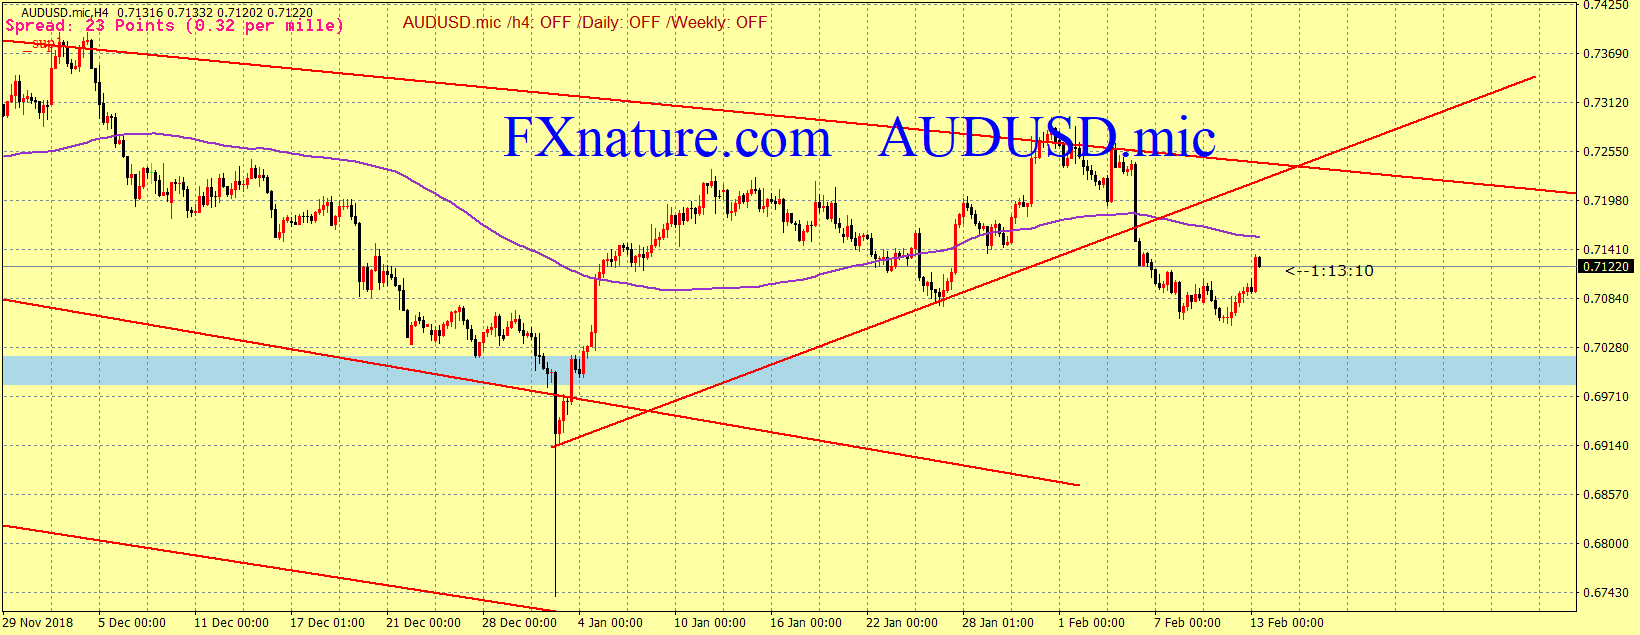
As you can see after price touch trend line return and are going to the blue support line in 0.7000 area.
Currently it seems in correction. After this correction we expect touch this support area. So the first target is 0.70000 and after that we expect reach to second trend line.
Technical analysis EURUSD
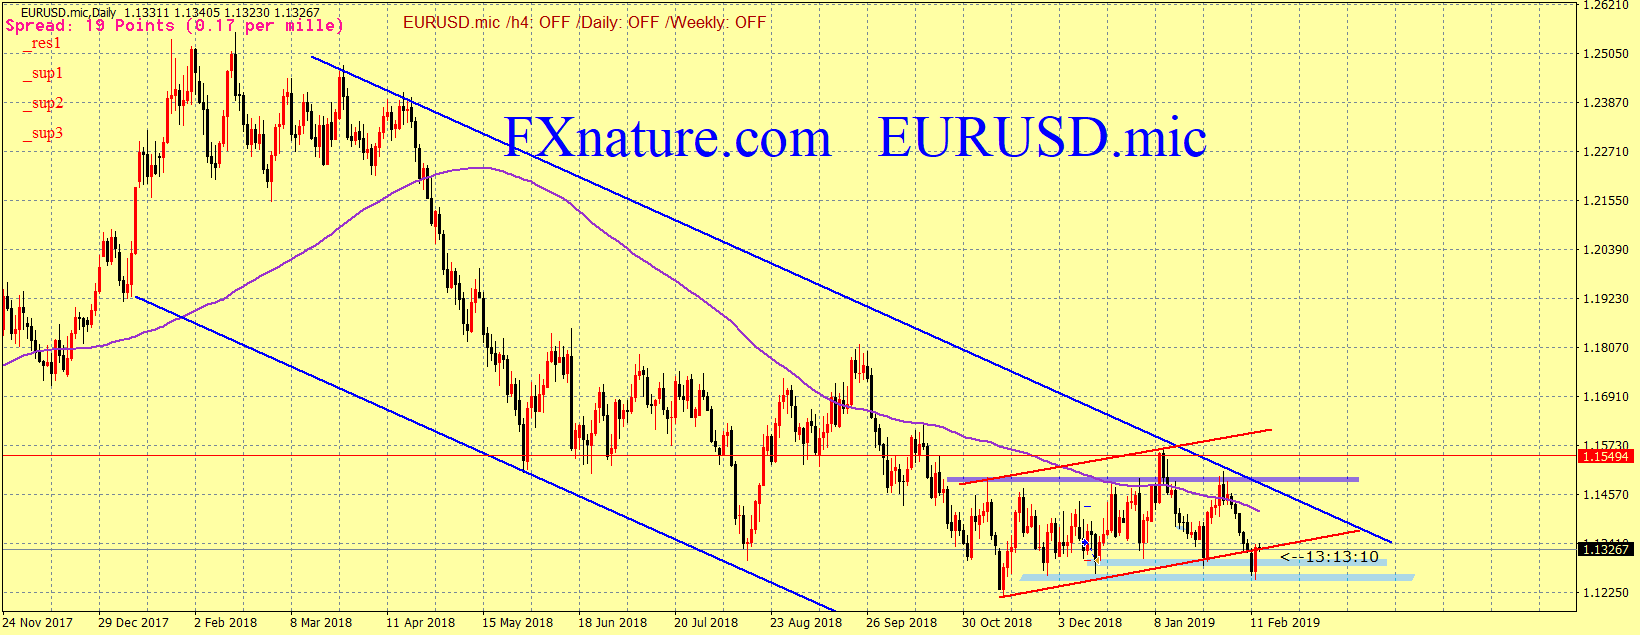
According daily time frame price after touch upper line of blue channel and resistance area returned .This turned continue until lower line of channel 2 (red channel) .Currently it seems lower channel is broken and we have opportunity for selling.The target is lower line of channel.although we have a pullback to lower line of channel but bearish scenario is remain and stable. If lower line of channel break scenario change to bullish .
Technical analysis GBPUSD
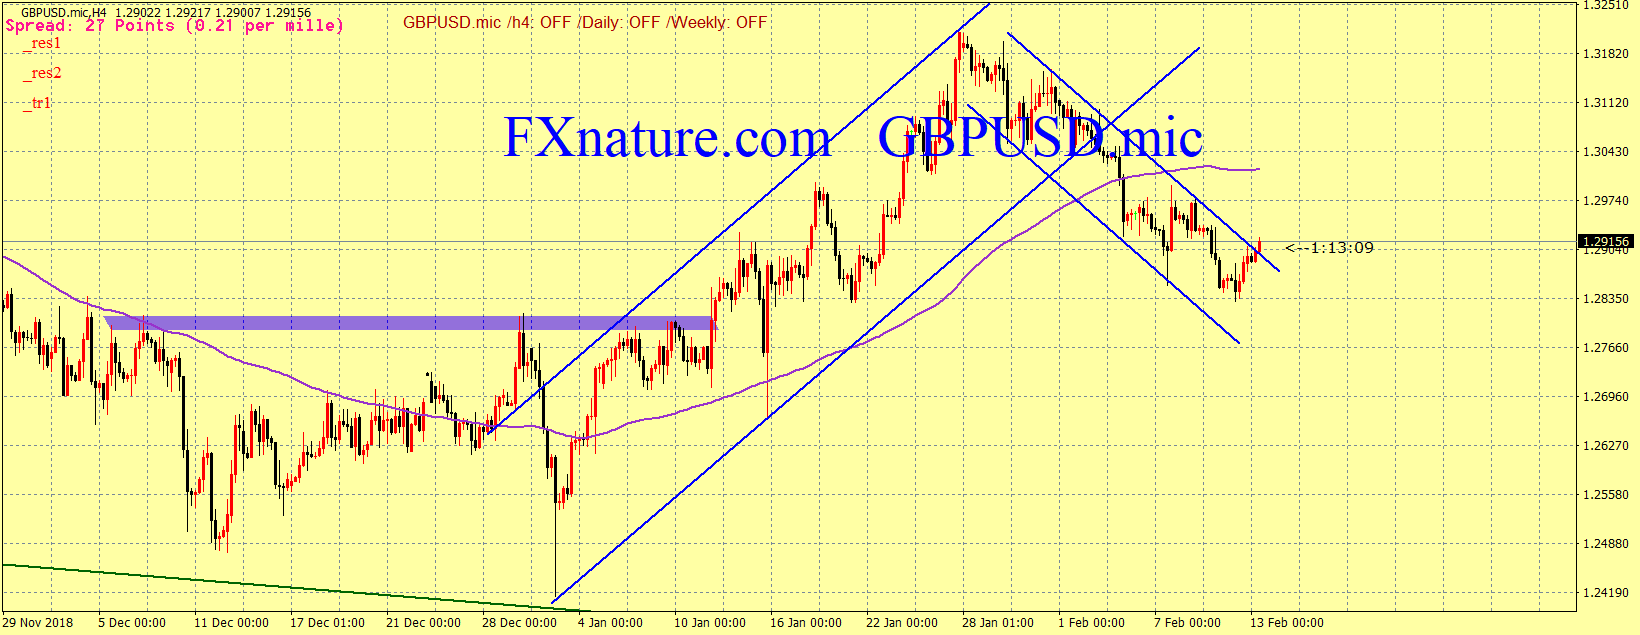
Price in previous week break lower line of bigger channel and exit from that. But it price movement provide new channel(smaller channel) and move on it. Price after a movement in new channel exit from upper line of channel. Although we have not confirmation for this exit . If exit for channel confirm we can buy with stop loss under the upper line of new channel.
Technical analysis NZDUSD
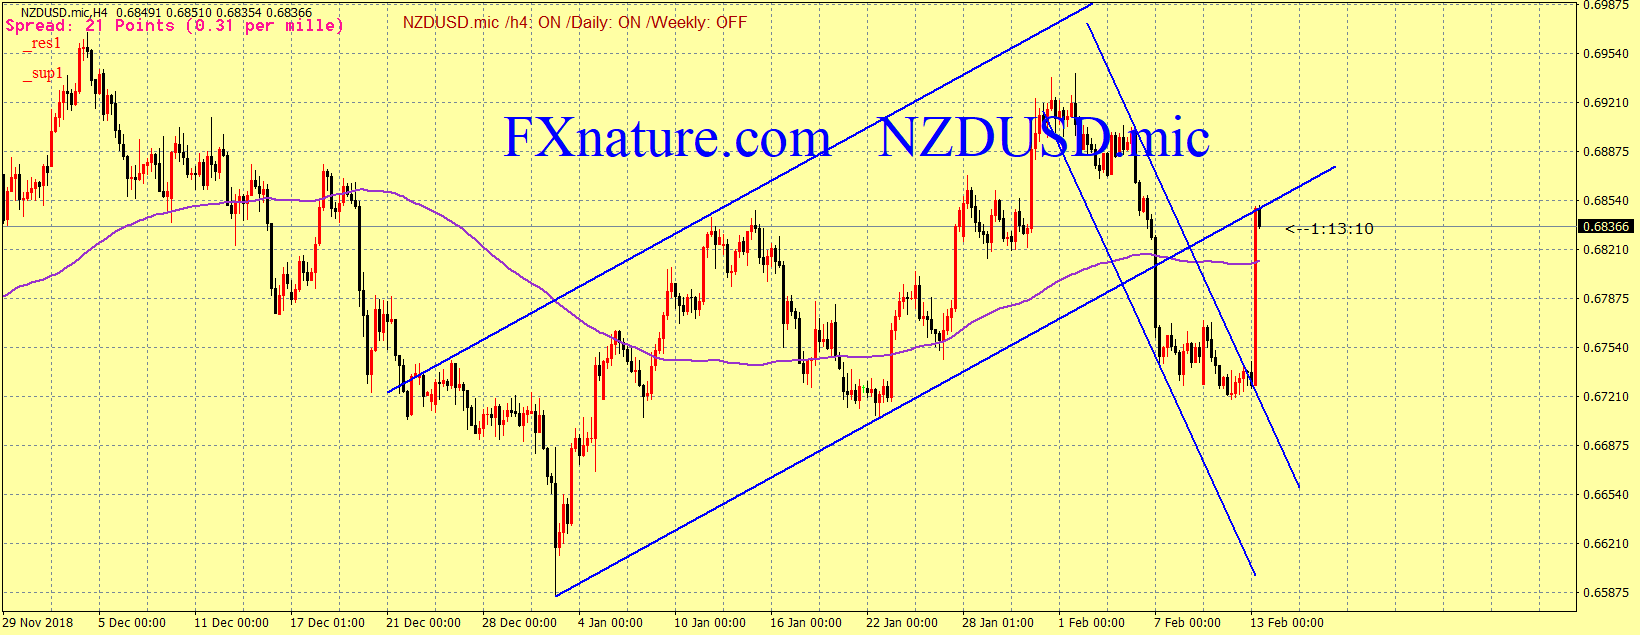
In the previous week price break old channel(ch1) and move in new channel(smaller ) now.
According previous forecast if new channel upper line break we expect a movement until lower line of lower channel.this event happened and after a good movement it is in correction.
Technical analysis USDCAD
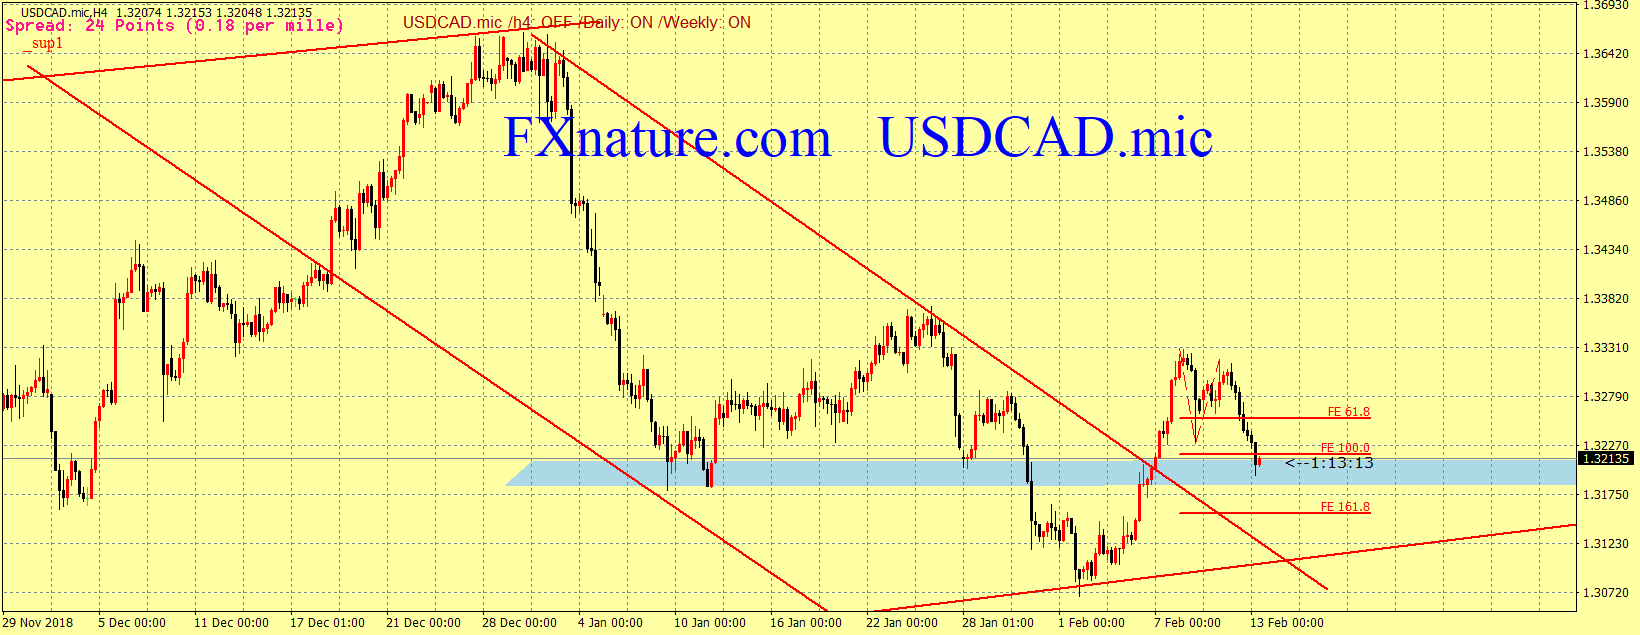
According last week forecast USDCAD after touching lower line of channel returned.It had a strong moved and stop and went in a correction with fundamental news.We forecast this bullish movement continue .
According last forecast price reach to support line at 100 Fibonacci ext . If we have any sign of bullish movement it is a good opportunity for buy.
Other wise if price passed 1.3190 in bearish we expect touch lower line of channel again
Technical analysis USDJPY
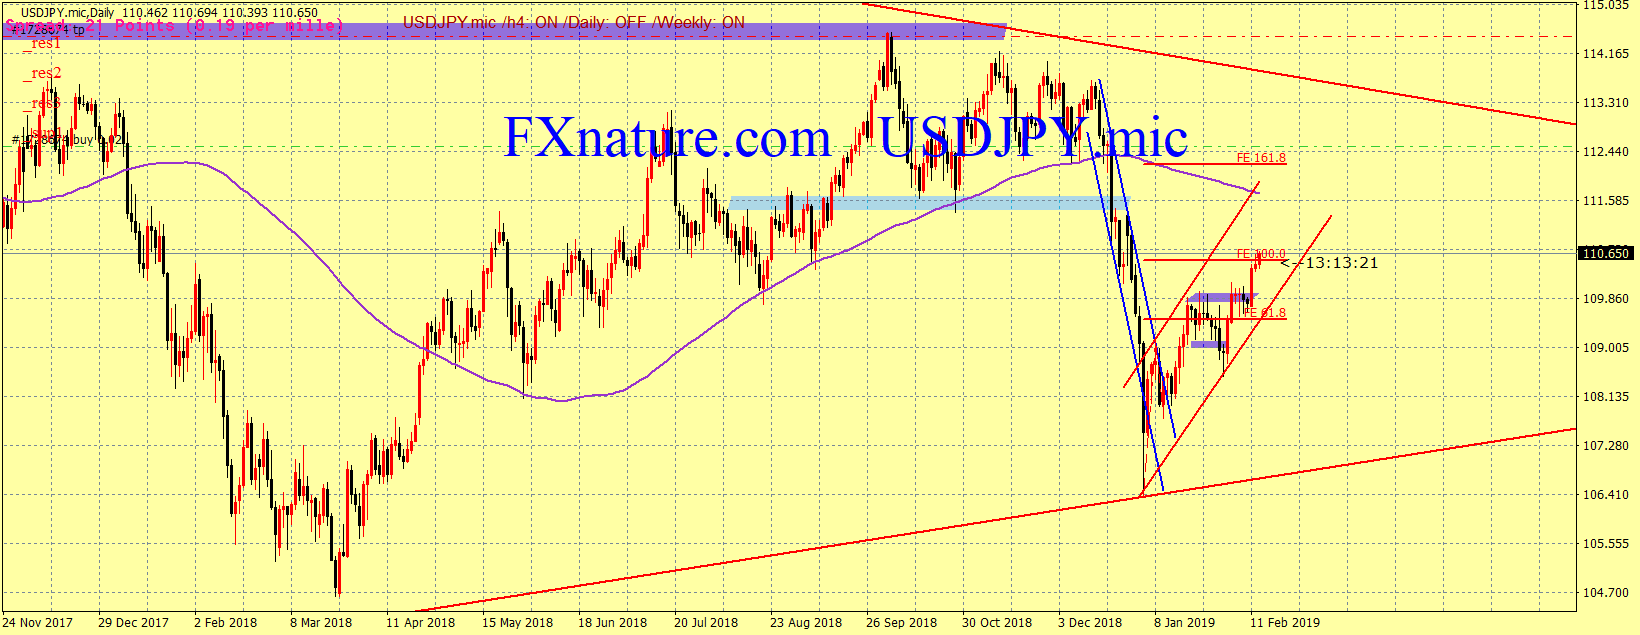
price move in ch1 channel in bullish way. The forecast target seems upper line of triangle in weekly time frame at 113.70 .Currently price break a strong resistance and touched first target . the second target is upper line of channel
If lower line of this channel break we sell . The target is lower line of triangle line
Technical analysis GOLD
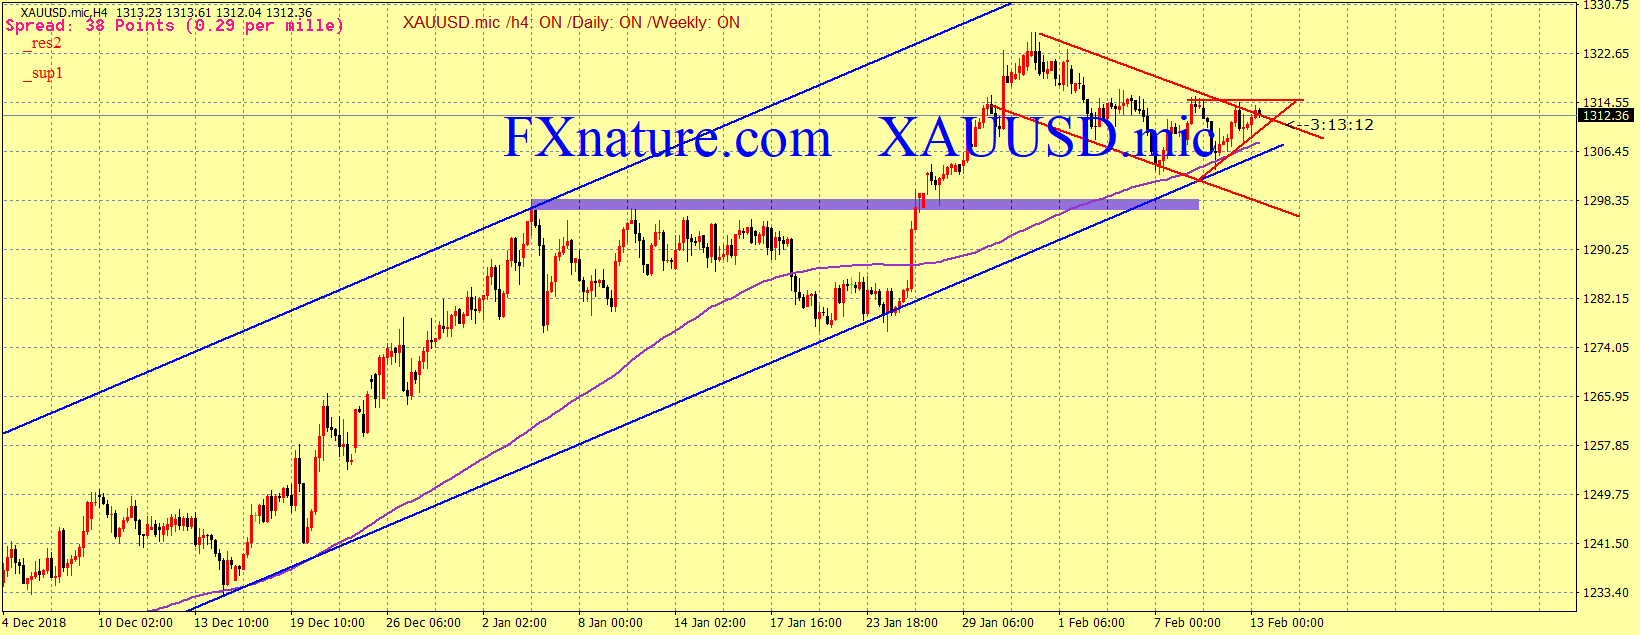
Price after touched lower line of channel returned but it remain in new red channel. If upper line of red channel breaks we expect strong movement of gold toward upper line of blue channel and price 1330 is accessible simply.please pay attention to triangle happened in H4 time frame.It as a confirmation for explosion movement .
