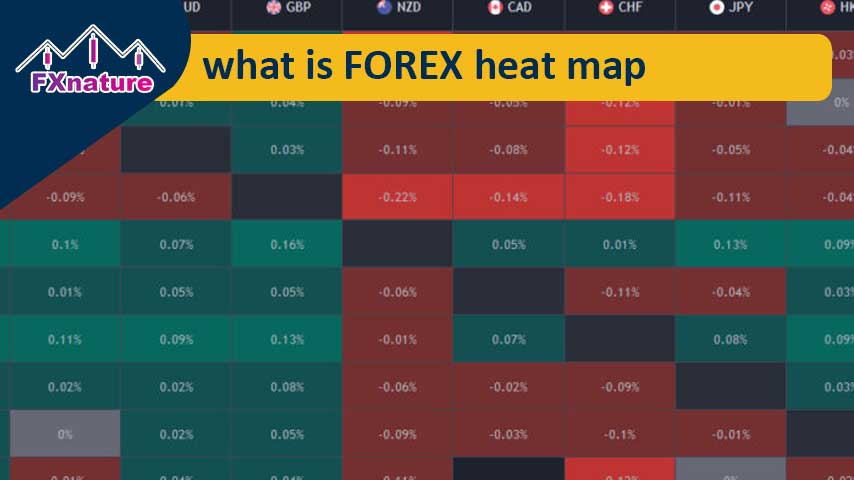
Forex Heat Map provides an online map of the strength and position of currencies in the Forex market. To describe the performance of this tool in this way, it can be said that each currency has strength and stability against other currencies. Now, if a currency has a high power against several currencies, then naturally we can say that in the current situation, this currency is strong and suitable for trading. Of course, the opposite is true of weak currencies.
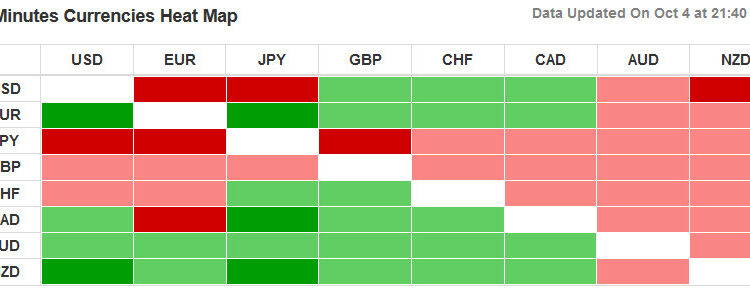
Basically, we consider 8 main currencies, which are:
EUR — Euro
USD — US Dollar
JPY — Japanese Yen
AUD — Australian Dollar
NZD — New Zealand Dollar
CAD — Canadian Dollars
CHF — Swiss Franc
GBP — British Pound
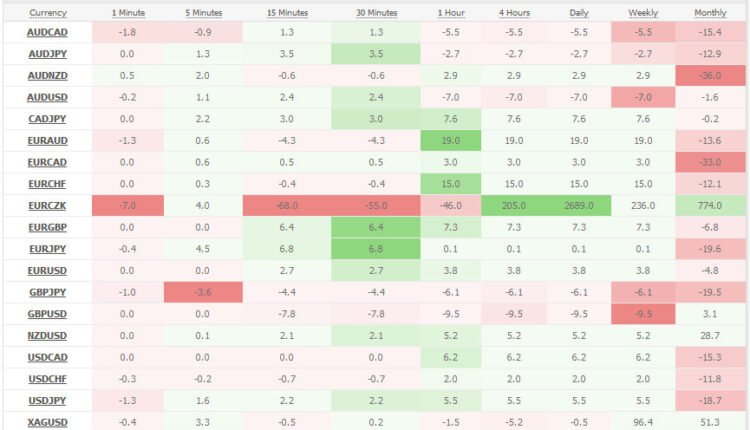
With these 8 currencies, 28 pairs of currencies are defined, the combination of which is used to measure the strength of currencies.
There are basically two important factors in displaying a Heat Map:
1- Background color
2- Percentage of movement
The background color is basically red to green. In other words, some map providers use the colors red and green in a fixed way. And in some providers, due to the fading and bold colors of red and green, they offer an assessment of the current strength of the currencies.
Displacement percentage Displays the amount of movement that the currency has moved. For example, suppose AUDUSD has a value of .0.9000. This pair has moved as much as 90 pips. Therefore, its movement percentage is 1.00%.
Now that the Heat Map has been explained, the question arises as to how it can be used.
First, the Heat Map allows traders to evaluate market data in less than 30 seconds. In other words, if the trader wants to evaluate the data of different currencies in a computational way, he must certainly spend a lot of time. If the Heat Map reveals the results very quickly.
How to use it in our transactions?
Perhaps one of the most common questions for any trader is:
When do I enter into a deal?
Which currency pair should we trade on?
Buy or sell?
….
Heat Map answers these questions.
To be clear, let’s explain the strategy.
1- Try to choose a currency for the trade that has a level of power compared to the other 7 currencies. In other words, it is strong or weak against all opposite currencies (green or red).
2- The percentage of movement of that currency pair is more than 0.25%. Values less than this number are not significant. (Note that the goal is its absolute value. In descending conditions, the percentage of fall is naturally negative)
Now that we have a specific strategy for using the Heat Map, we need to be able to combine it with other strategies. In other words, using the Heat Map with trend lines, support and resistance, etc. can be a good factor to answer the above questions and succeed in trading.
Note: Heat Map In many cases where conflicting signals are issued for different currency pairs, it issues very good warnings and prevents us from entering the wrong trades.
Note: In many cases, the Heat Map informs about sudden movements, news conditions, etc., and keeps us away from error trades.
Note: If when choosing a currency you see that there are different signals in the Heat Map and that currency has different conditions, it is better to skip trading on that currency now.
Note: If a currency has a good strength or weakness against other currencies and you have a trading installment on the currency pair that is one side of it, it is better to have an evaluation on the other side to be sure of your trade.
